1.1.4 PET & Ultrasound Imaging
"Functional imaging allows us to see the activity of life, not just the structure of the body." — A New Era of Medical Imaging
In previous chapters, we learned about three major anatomical imaging technologies: CT, MRI, and X-ray. Now, let's explore two unique imaging modalities: PET (Positron Emission Tomography) and Ultrasound Imaging. PET represents functional imaging, capable of displaying tissue metabolic activity; ultrasound is the exemplar of real-time imaging—radiation-free, portable, and economical. These two technologies form a perfect complement to the anatomical imaging technologies discussed earlier.
🔬 Part 1: PET (Positron Emission Tomography)
From Antimatter to Medical Imaging
Discovery of the Positron: Antimatter's First Appearance
In 1932, American physicist Carl Anderson at Caltech, while studying cosmic rays, observed a peculiar particle track in a cloud chamber: it had the same mass as an electron but opposite charge. This was the positron, the first antimatter particle discovered by humans. Anderson received the 1936 Nobel Prize in Physics for this discovery.
At the time, no one imagined that this seemingly pure physics discovery would completely transform medical diagnosis decades later.
💡 What is Antimatter?
Antimatter is the "mirror image" of normal matter: the positron is the antiparticle of the electron, and the antiproton is the antiparticle of the proton. When matter and antimatter meet, annihilation occurs, with mass completely converting to energy, producing high-energy photons. This process follows Einstein's mass-energy equation E=mc². PET imaging utilizes precisely this physical phenomenon.
Radioactive Tracers: Tracking Life's Footprints
In 1943, Hungarian chemist George de Hevesy received the Nobel Prize in Chemistry for developing radioactive tracer technology. His pioneering work demonstrated that radioactive isotopes could be used to label substances and then track their metabolic processes in living organisms.
This idea laid the foundation for functional imaging: if we could label glucose with radioactive isotopes, we could see energy consumption in different parts of the body.
Birth of the First PET Scanner
In 1973, at Washington University School of Medicine, physicists Michael Phelps and Edward Hoffman, under the guidance of Michel Ter-Pogossian, built the world's first PET scanner—PETT I (Positron Emission Transaxial Tomograph).
This device had only one detector ring and required hours for a single scan, but it proved the feasibility of PET imaging.
FDG: The "Fuel" of PET Imaging
In 1976, at Brookhaven National Laboratory in the United States, Tatsuo Ido, Al Wolf, and Joanna Fowler successfully synthesized ¹⁸F-fluorodeoxyglucose (FDG).
FDG is a glucose analog that is taken up by cells but not completely metabolized, thus accumulating in metabolically active tissues. Since cancer cells' metabolic rate is typically several times that of normal cells, FDG-PET became a powerful tool for tumor diagnosis.
🎯 Why Do Cancer Cells "Love" Glucose?
This is called the Warburg effect: even under aerobic conditions, cancer cells tend to obtain energy through glycolysis rather than the more efficient aerobic respiration. This causes cancer cells to take up glucose at rates far higher than normal cells, enabling FDG-PET to "light up" tumors.
PET Imaging Principle: Capturing the Glow of Annihilation
Positron Annihilation: A Microscopic "Firework"
The core of PET imaging is the positron annihilation process:
- Radioactive Tracer Injection: Inject a tracer (such as FDG) labeled with a positron-emitting nuclide (such as ¹⁸F) into the patient
- Positron Emission: The radioactive nuclide decays, releasing positrons
- Positron Annihilation: The positron travels a very short distance in tissue (about 1-2 millimeters) before encountering an electron and annihilating
- Photon Pair Production: Annihilation produces two γ photons with energy of 511 keV, flying out in opposite directions at 180 degrees
- Coincidence Detection: The PET scanner's detector ring simultaneously detects this photon pair, determining the location of annihilation
Coincidence Detection Technology: Timing is Everything
PET scanners use coincidence detection technology:
- Only photon pairs detected simultaneously by two opposing detectors within an extremely short time window (typically <10 nanoseconds) are considered to come from the same annihilation event
- The line connecting the two detectors is called the Line of Response (LOR)
- Through reconstruction of millions of LORs, a three-dimensional distribution image of the tracer in the body can be obtained
Commonly Used Radioactive Tracers
| Tracer | Half-life | Labeling Nuclide | Main Applications |
|---|---|---|---|
| ¹⁸F-FDG | 110 minutes | ¹⁸F | Tumors, heart, brain metabolism |
| ¹¹C-Methionine | 20 minutes | ¹¹C | Brain tumors, protein synthesis |
| ¹³N-Ammonia | 10 minutes | ¹³N | Myocardial perfusion |
| ¹⁵O-Water | 2 minutes | ¹⁵O | Cerebral blood flow |
| ⁶⁸Ga-PSMA | 68 minutes | ⁶⁸Ga | Prostate cancer |
⚠️ Safety of Radioactive Tracers
Although PET uses radioactive materials, the radiation dose is controllable:
- A single FDG-PET scan has an effective dose of about 5-7 mSv, equivalent to 1-2 abdominal CT scans
- Tracers have very short half-lives (¹⁸F is 110 minutes), decaying rapidly
- Tracer amounts are extremely small (typically <10 milligrams), producing no pharmacological effects
- Pregnant and lactating women require special risk-benefit assessment
PET Fusion with CT/MRI: 1+1>2
PET images alone only show functional information, lacking anatomical detail. In 2000, David Townsend's team developed the first commercial PET-CT scanner, named "Medical Invention of the Year 2000" by Time magazine.
Advantages of PET-CT:
- CT provides precise anatomical localization
- CT data used for PET image attenuation correction, improving quantitative accuracy
- One scan simultaneously obtains functional and anatomical information
- Scan time reduced from 2 hours to 30 minutes
In the 2010s, PET-MRI began clinical application, combining MRI's excellent soft tissue contrast with PET's functional imaging capability, particularly suitable for brain and pelvic imaging.
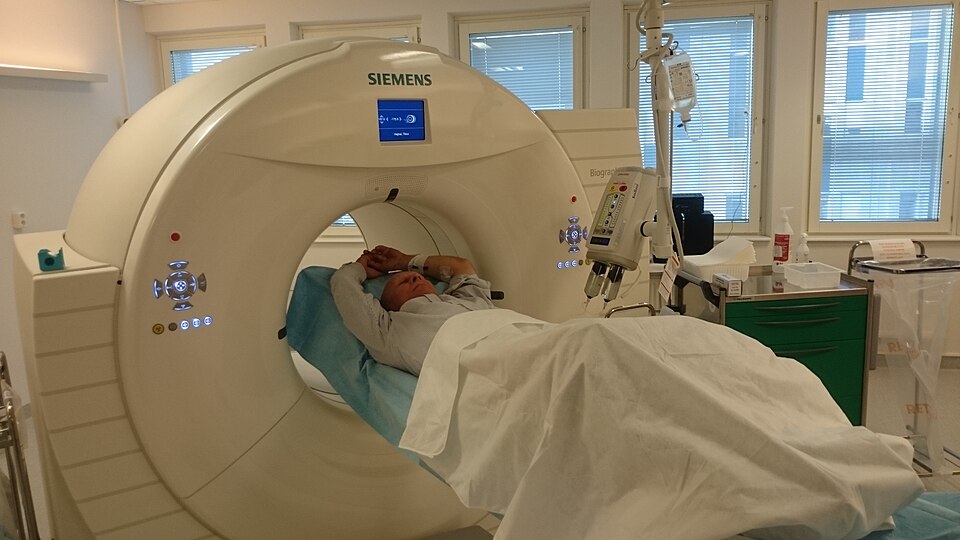 Modern PET-CT scanner, perfectly integrating functional and anatomical imaging
Evolution of PET Technology
| Era | Milestone Events | Key Technologies | Scan Time | Main Applications |
|---|---|---|---|---|
| 1970s-1980s | Proof of concept stage | Single-ring detector, BGO crystal | 2-4 hours | Brain metabolism research |
| 1973: First PET scanner (PETT I) | ||||
| 1976: FDG synthesis successful | ||||
| 1990s-2000s | Clinical application popularization | Multi-ring detector, whole-body scanning | 30-60 minutes | Tumor diagnosis and staging |
| FDG-PET became tumor diagnosis standard | ||||
| 1998: FDA approved FDG for clinical use | ||||
| 2000s | Fusion imaging era | PET-CT, LSO crystal | 15-30 minutes | Tumors, heart, neurology |
| 2000: First commercial PET-CT | ||||
| Time-of-flight (TOF) technology | ||||
| 2010s | Multimodal & precision imaging | PET-MRI, digital PET | 10-20 minutes | Precision medicine, early diagnosis |
| 2010: First PET-MRI | ||||
| Fully digital PET detectors | ||||
| 2020s-present | Whole-body & ultra-fast imaging | Whole-body PET, AI reconstruction | <10 minutes | Whole-body tumor screening |
| Long Axial Field of View (LAFOV) PET | ||||
| Ultra-sensitive detectors |
Key Technology Breakthroughs
| Technology Category | Technology Name | Time | Core Contribution | Performance Improvement |
|---|---|---|---|---|
| Detector | BGO crystal | 1980s | High density, high stopping power | Improved detection efficiency |
| Detector | LSO/LYSO crystal | 2000s | Faster decay time | Improved count rate, better image quality |
| Detector | Digital SiPM | 2010s | Fully digital, high sensitivity | Improved time resolution, reduced dose |
| Imaging Technology | Time-of-Flight (TOF) | 2000s | Utilize photon arrival time difference | Improved SNR 30-40% |
| Imaging Technology | Point Spread Function (PSF) reconstruction | 2000s | Compensate system response | Improved spatial resolution |
| Fusion Imaging | PET-CT | 2000 | Anatomy + function | Improved diagnostic accuracy, reduced scan time |
| Fusion Imaging | PET-MRI | 2010 | Soft tissue contrast + function | Reduced radiation, improved soft tissue resolution |
| AI Assistance | Deep learning reconstruction | 2010s | Denoising, accelerated imaging | Reduced dose 50%, shortened scan time |
🚀 Whole-Body PET: One Scan, Full Body View
In 2018, a research team at UC Davis developed the EXPLORER whole-body PET scanner with an axial field of view of 2 meters, capable of covering the entire body in one scan. This Long Axial Field of View (LAFOV) PET offers advantages:
- 40x sensitivity improvement
- Scan time reduced from 20 minutes to 1 minute
- 40% radiation dose reduction
- Can perform whole-body dynamic imaging, observing real-time tracer distribution throughout the body
This opens new possibilities for whole-body tumor screening and systemic disease diagnosis.
Clinical Significance of PET Technology
| Application Area | Typical Applications | Clinical Value | Common Tracers |
|---|---|---|---|
| Oncology | Tumor diagnosis and staging | Early detection, accurate staging, metastasis assessment | ¹⁸F-FDG |
| Treatment response evaluation | Early assessment of treatment response, adjust regimen | ¹⁸F-FDG | |
| Radiation therapy planning | Precise tumor boundary localization | ¹⁸F-FDG, ¹¹C-Methionine | |
| Neurology | Alzheimer's disease | Early diagnosis, differential diagnosis | ¹⁸F-FDG, amyloid tracers |
| Epilepsy | Epileptogenic focus localization | ¹⁸F-FDG | |
| Parkinson's disease | Dopamine system assessment | ¹⁸F-DOPA | |
| Cardiovascular | Myocardial viability assessment | Determine if myocardial damage is reversible | ¹⁸F-FDG, ¹³N-Ammonia |
| Myocardial perfusion | Assess coronary artery disease | ¹³N-Ammonia, ⁸²Rb | |
| Infection/Inflammation | Infection focus localization | Etiological diagnosis of fever of unknown origin | ¹⁸F-FDG |
🔊 Part 2: Ultrasound Imaging
From Sonar to Medical Imaging
Early Applications of Ultrasound
Ultrasound waves (frequency >20 kHz, beyond human hearing range) were first applied during World War I in sonar (SONAR) technology for detecting submarines. After the war, ultrasound technology was used for industrial flaw detection, checking for cracks inside metals.
But applying ultrasound to medical diagnosis was a much greater challenge: human tissue is far more complex than metal, and real-time imaging is required.
Pioneers of Medical Ultrasound
In 1942, Austrian neurologist Karl Dussik first attempted to use ultrasound transmission imaging to diagnose brain tumors. Although this attempt was unsuccessful (ultrasound cannot penetrate the skull), it opened the exploration of medical ultrasound.
In 1958, Ian Donald, an obstetrician at the University of Glasgow in Scotland, published a landmark paper demonstrating ultrasound applications in obstetric diagnosis. He collaborated with engineer Tom Brown to improve industrial flaw detection equipment, successfully using ultrasound to observe fetuses and ovarian cysts.
👶 Ultrasound Transformed Obstetrics
Before ultrasound, doctors could only assess fetal condition through palpation and auscultation, with many abnormalities undetectable before birth. Ultrasound completely changed this:
- Confirm pregnancy and number of fetuses
- Assess fetal growth and development
- Detect fetal malformations
- Monitor placental position
- Guide procedures like amniocentesis
Ultrasound made prenatal diagnosis possible, greatly reducing maternal and neonatal mortality.
Real-Time Ultrasound Breakthrough
Early ultrasound devices could only produce static images, requiring manual scanning and recording. In the 1970s, with advances in electronics, real-time B-mode ultrasound emerged, capable of producing dozens of frames per second, enabling dynamic observation.
This made ultrasound a true "real-time imaging" tool, capable of observing heartbeats, blood flow, fetal movement, and other dynamic processes.
Ultrasound Imaging Principle: The Echo of Sound Waves
Nature of Ultrasound
Ultrasound is a mechanical wave that requires a medium for propagation and cannot travel in a vacuum. Medical ultrasound frequencies typically range from 1-20 MHz:
- Low frequency (1-5 MHz): Strong penetration, used for deep organs (such as abdomen)
- High frequency (7-20 MHz): High resolution, used for superficial structures (such as thyroid, vessels)
Ultrasound Generation: Piezoelectric Effect
The core of an ultrasound transducer is a piezoelectric crystal (such as lead zirconate titanate, PZT):
- Direct piezoelectric effect: Apply voltage → crystal vibrates → produces ultrasound
- Inverse piezoelectric effect: Ultrasound → crystal vibrates → produces voltage
The same crystal serves as both transmitter and receiver, alternately emitting and receiving ultrasound.
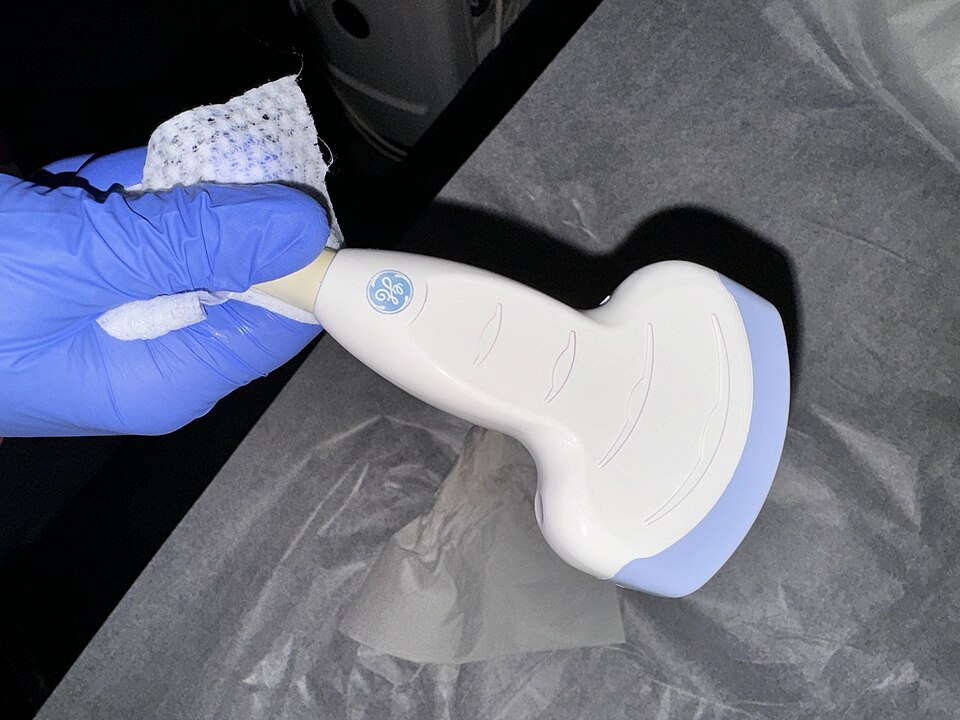 Medical ultrasound linear array probe, containing multiple piezoelectric crystal arrays
Ultrasound Interactions with Tissue
When ultrasound propagates through tissue, several phenomena occur:
1. Reflection
- Occurs at interfaces between different tissues
- Reflection intensity depends on acoustic impedance difference
- This is the main source of ultrasound imaging information
2. Scattering
- Occurs when encountering structures smaller than wavelength
- Produces tissue "texture" information
3. Attenuation
- Ultrasound energy gradually weakens with depth
- Attenuation degree proportional to frequency
- Limits ultrasound penetration depth
4. Refraction
- Ultrasound changes direction at interfaces
- May produce artifacts
Ultrasound Imaging Modes
| Mode | Full Name | Display Method | Main Applications |
|---|---|---|---|
| A-mode | Amplitude mode | One-dimensional waveform | Ophthalmology (eye axis length measurement) |
| B-mode | Brightness mode | Two-dimensional grayscale image | Most common, abdomen, obstetrics, heart, etc. |
| M-mode | Motion mode | Time-depth curve | Cardiac valve motion, fetal heart monitoring |
| Color Doppler | Color Doppler | Color blood flow overlaid on B-mode image | Vessels, cardiac blood flow |
| Spectral Doppler | Spectral Doppler | Blood flow velocity-time curve | Hemodynamic assessment |
| Power Doppler | Power Doppler | Display blood flow energy distribution | Low-velocity flow, tumor vessels |
Doppler Effect: Seeing Blood Flow
Doppler effect: When a sound source and observer are in relative motion, the observed frequency changes. In medical ultrasound:
- Blood flowing toward probe → frequency increases (typically displayed as red)
- Blood flowing away from probe → frequency decreases (typically displayed as blue)
By measuring frequency change, blood flow velocity can be calculated:
Where: v is blood flow velocity, c is sound speed, Δf is frequency change, f₀ is transmitted frequency, θ is angle between ultrasound beam and blood flow direction.
💡 Why Does Ultrasound Examination Require Coupling Gel?
Air's acoustic impedance differs greatly from human tissue, causing ultrasound to almost completely reflect at the air-skin interface, unable to enter the body. Coupling gel (typically water-based gel) eliminates air between the probe and skin, ensuring ultrasound can effectively enter the body. This is like using immersion oil in optical microscopy to improve resolution.
Evolution of Ultrasound Technology
| Era | Milestone Events | Key Technologies | Image Quality | Main Applications |
|---|---|---|---|---|
| 1940s-1960s | Exploration stage | A-mode ultrasound, contact scanning | One-dimensional waveform | Brain midline, ophthalmology |
| 1942: Dussik attempted brain ultrasound | ||||
| 1958: Ian Donald obstetric ultrasound | ||||
| 1970s-1980s | Real-time imaging era | Real-time B-mode, linear/convex array probes | Grayscale images | Obstetrics, abdomen, heart |
| 1970s: Real-time B-mode emerged | ||||
| Grayscale imaging technology | ||||
| 1980s-1990s | Color Doppler era | Color Doppler, spectral Doppler | Color blood flow images | Vessels, heart, obstetrics |
| 1980s: Color Doppler imaging | ||||
| Digital ultrasound systems | ||||
| 1990s-2000s | 3D imaging era | 3D/4D ultrasound, harmonic imaging | Three-dimensional images | Obstetrics (fetal face), heart |
| 1990s: 3D ultrasound reconstruction | ||||
| Tissue Harmonic Imaging (THI) | ||||
| 2000s-2010s | Functional imaging era | Contrast-enhanced ultrasound, elastography | Functional information | Tumors, liver, breast |
| 2000s: Microbubble contrast agents | ||||
| Shear wave elastography | ||||
| 2010s-present | Intelligence era | AI-assisted diagnosis, portable ultrasound | Intelligent optimization | General applications, telemedicine |
| Deep learning image enhancement | ||||
| Handheld ultrasound devices |
Key Technology Breakthroughs
| Technology Category | Technology Name | Time | Core Contribution | Clinical Value |
|---|---|---|---|---|
| Imaging Technology | Real-time B-mode | 1970s | Dynamic observation | Enable cardiac, fetal dynamic imaging |
| Imaging Technology | Color Doppler | 1980s | Blood flow visualization | Vascular disease diagnosis, cardiac valve assessment |
| Imaging Technology | Tissue Harmonic Imaging (THI) | 1990s | Utilize second harmonic | Improve image contrast and resolution |
| Imaging Technology | 3D/4D ultrasound | 1990s | Three-dimensional imaging | Fetal malformation diagnosis, cardiac structure assessment |
| Contrast Technology | Contrast-Enhanced Ultrasound (CEUS) | 2000s | Microbubble contrast agents | Tumor blood supply assessment, liver lesion differentiation |
| Functional Imaging | Elastography | 2000s | Tissue stiffness measurement | Liver fibrosis assessment, breast mass differentiation |
| Probe Technology | Phased array probe | 1980s | Electronic scanning | Cardiac imaging, transcranial Doppler |
| AI Assistance | Deep learning enhancement | 2010s | Automatic measurement, lesion detection | Improve diagnostic efficiency and accuracy |
🎯 Ultrasound Elastography: "Touching" Tissue Stiffness
Traditionally, doctors assess tissue stiffness (such as whether a mass is hard or soft) through palpation. Ultrasound elastography digitizes this palpation:
- Strain elastography: Manually compress tissue, observe deformation degree
- Shear wave elastography: Emit "push pulse" to generate shear waves, measure propagation velocity to quantitatively assess stiffness
This technology is particularly useful in liver fibrosis assessment, non-invasively replacing liver biopsy.
Clinical Significance of Ultrasound Technology
| Application Area | Typical Applications | Clinical Value | Technical Features |
|---|---|---|---|
| Obstetrics | Fetal monitoring | Assess fetal growth, detect malformations | Real-time, no radiation, repeatable |
| Prenatal diagnosis | Down syndrome screening, structural abnormalities | 3D/4D imaging | |
| Cardiology | Echocardiography | Assess cardiac structure and function | Real-time, Doppler blood flow |
| Valvular disease | Diagnose valve stenosis or regurgitation | Color Doppler | |
| Abdomen | Liver, gallbladder, pancreas, spleen | Stones, tumors, inflammation diagnosis | No radiation, convenient |
| Liver fibrosis | Non-invasive assessment of cirrhosis degree | Elastography | |
| Vascular | Carotid artery | Atherosclerosis, stenosis assessment | Doppler blood flow |
| Deep vein thrombosis | DVT diagnosis | Real-time compression test | |
| Breast | Mass differentiation | Benign-malignant differentiation | Elastography, contrast |
| Interventional Guidance | Biopsy | Real-time needle guidance | Real-time imaging |
| Treatment monitoring | Ablation treatment monitoring | Real-time, no radiation |
🔄 Part 3: Comparison and Complementarity of PET and Ultrasound
Although PET and ultrasound are completely different imaging technologies, they form an interesting complementary relationship in clinical practice:
| Feature | PET | Ultrasound |
|---|---|---|
| Imaging Principle | Positron annihilation, γ-ray detection | Ultrasound wave reflection |
| Information Type | Functional imaging (metabolism, receptor distribution) | Anatomical imaging (structure, blood flow) |
| Temporal Resolution | Low (minute-level) | Extremely high (real-time, millisecond-level) |
| Spatial Resolution | Medium (4-6 mm) | High (0.1-1 mm) |
| Penetration Depth | Whole body | Limited (<20 cm) |
| Radiation | Yes (5-7 mSv) | None |
| Contrast Agent | Radioactive tracers | Microbubble contrast agents (optional) |
| Cost | Very high | Low |
| Portability | None (large equipment) | High (portable) |
| Operator Dependence | Low | High |
| Typical Applications | Tumor staging, treatment response, neurodegenerative diseases | Obstetrics, heart, abdomen, vessels, interventional guidance |
| Advantages | Whole-body imaging, early metabolic changes, quantitative analysis | Real-time, no radiation, portable, economical, repeatable |
| Limitations | Radiation, high cost, low temporal resolution, requires cyclotron | Operator dependent, limited penetration depth, bone and gas interference |
💡 The Power of Complementarity
PET and ultrasound are often used complementarily in clinical practice:
- Tumor Diagnosis: PET detects whole-body metastases, ultrasound guides biopsy
- Treatment Response: PET assesses metabolic response, ultrasound monitors tumor size changes
- Cardiac Disease: PET assesses myocardial viability, ultrasound assesses cardiac structure and function
- Obstetrics: Ultrasound is the first choice for prenatal examination (no radiation), PET requires careful risk-benefit assessment for pregnant women with tumors
Each technology has its strengths, and reasonable selection and combined use can provide the best diagnostic approach for patients.
💡 Key Takeaways
Historical Significance of PET: From the discovery of the positron in 1932, to the first PET scanner in 1973, to the synthesis of FDG in 1976, PET pioneered a new era of functional imaging, enabling us to "see" tissue metabolic activity.
PET Imaging Principle: Utilizes 511 keV photon pairs produced by positron annihilation, reconstructing three-dimensional tracer distribution through coincidence detection technology. FDG-PET exploits cancer cells' high metabolic characteristics, becoming a powerful tool for tumor diagnosis.
PET Technology Evolution: From early single-ring detectors to modern PET-CT and PET-MRI fusion imaging, from hours-long scans to 10-minute whole-body imaging, PET technology continues to advance. Whole-body PET (LAFOV) represents the latest development direction.
Historical Significance of Ultrasound: From Dussik's early attempts in 1942 to Ian Donald's successful obstetric application in 1958, ultrasound became one of the most widely used medical imaging technologies, completely transforming obstetrics.
Ultrasound Imaging Principle: Utilizes ultrasound wave reflection at different tissue interfaces, achieving transmission and reception through the piezoelectric effect. The Doppler effect enables blood flow visualization. Ultrasound is the only real-time, radiation-free imaging technology.
Ultrasound Technology Evolution: From A-mode ultrasound to real-time B-mode, from grayscale imaging to color Doppler, from 2D to 3D/4D, from pure anatomical imaging to functional imaging (elastography, contrast), ultrasound technology continues to innovate.
Complementarity of PET and Ultrasound: PET provides whole-body functional information, suitable for tumor staging and treatment response assessment; ultrasound provides real-time anatomical information, suitable for dynamic observation and interventional guidance. Combined use provides more comprehensive diagnostic information.
Safety Considerations: PET uses radioactive tracers with some radiation dose (5-7 mSv), but within acceptable range; ultrasound is completely radiation-free, making it the first choice for pregnant women and children.
💡 Next Steps
Now you understand four major medical imaging modalities (CT, MRI, X-ray, PET) and one special imaging technology (ultrasound). In Chapter 3, we will delve into reconstruction algorithms and image enhancement techniques for these images. In Chapter 2, we will learn about medical image data format standards (such as DICOM) and commonly used open-source tools.