Integrated Development Environment (IDE) Basics
💡 Learning Guide
This chapter will take you deep into the core productivity tool for programmers—the Integrated Development Environment (IDE). We'll start from the design philosophy of IDEs, analyze their core components one by one, and demonstrate their working principles through a virtual IDE.
What to Do When You Don't Understand Something? (How to solve problems)
In the process of learning and using an IDE, you may encounter various buttons, menus, or code errors that you don't understand. At this time, don't panic—using an AI assistant is the most efficient solution.
Recommended Approach: Screenshot and Ask AI
Modern AIs (such as ChatGPT, Claude, DeepSeek, etc.) have powerful image recognition capabilities. When you encounter unfamiliar interface elements or complex code snippets:
- Screenshot: Capture the part you don't understand (such as a strange icon or a complex configuration code).
- Ask: Send the image to AI and ask: "What is this? What's it for?" or "What does xxx do in this code?"
- Follow up: If AI's answer is too technical to understand, continue asking: "Please explain it in plain language, preferably with a real-life example."
0. Introduction: Why Do We Need an IDE?
In the software development process, programmers need to frequently write code, manage files, compile and run programs, debug errors, and so on. If all these operations needed to be completed in different independent software (for example, using Notepad to write code, command line to compile, and file folders to manage files), efficiency would be extremely low and error-prone.
The core value of an IDE (Integrated Development Environment) lies in integration. It integrates various tools needed for software development (editor, compiler, debugger, file manager, etc.) into a unified graphical interface, providing a one-stop working experience.
VS Code is one of the most popular IDEs. Although it is essentially a lightweight code editor, through its powerful plugin system, it has all the core functions of an IDE (code editing, debugging, version control, etc.), and is therefore widely regarded as the preferred IDE for modern frontend and full-stack development.
In short, IDEs aim to maximize developer productivity and reduce the time cost of switching between different tools.
🔗 Resource Downloads:
VS Code (Visual Studio Code) is a free, open-source, cross-platform code editor developed by Microsoft. With its lightweight nature, rich plugins, and fast startup speed, it has become one of the most popular development tools worldwide. Whether you're writing Python, JavaScript, or C++, VS Code can become the most suitable "tool" for you through plugin installation.
1. Core Interface Analysis
The interface layout of modern IDEs (taking VS Code as an example) has been carefully designed and usually contains the following four core areas:
Sidebar: Resource Management Displays the project's file tree, supports creating, renaming, moving, and deleting files, providing a global view and quick access to the project structure.
Editor Area: Code Creation The core area for writing and modifying code. Supports syntax highlighting, intelligent code completion, syntax checking, and other functions, providing an efficient and intelligent code writing environment.
Bottom Panel: Execution and Feedback Interacts with the underlying system and views running results. Includes Terminal, Output, etc., used for executing commands, viewing logs, and debugging.
Activity Bar: Function Navigation Located on the far left of the interface, containing icons for file explorer, search, Git management, etc., used to quickly switch between different work contexts (such as "writing code" and "submitting code").
2. Interactive Demo: Functional Experience
Seeing is believing. To let you truly feel the convenience of an IDE, we have prepared a virtual VS Code environment for you.
Please try the following operations:
- Click the "▶ Start Auto Tour" button in the upper right corner to follow the cursor and learn about each area.
- Free Exploration: Click the icons on the left to switch views, or click file names to open code.
- Experience Integration: You'll find that file management, code editing, and terminal running are all seamlessly connected within the same window.
- Install Plugins: Select "Extensions Installation" mode from the dropdown menu to experience how to install Python plugins in a virtual store.
3. Core Mechanism: Why Can VS Code Do Everything?
You might be curious: Why can the same software write Python, C++, and do web development? How does it do it? Actually, VS Code's design philosophy can be summarized in one sentence: "Minimalist core, pluggable capabilities."
3.1 Minimalist Core: Just a "Canvas"
Imagine, the VS Code you just downloaded, if no plugins are installed, actually doesn't understand programming. At this point, it is essentially just a powerful text editor.
- It is responsible for displaying text (rendering).
- It is responsible for managing files (IO).
- But it doesn't know that
print("Hello")is Python code, nor does it know thatint main()is a C++ entry point.
3.2 Plugin System: Injecting "Soul"
To make VS Code able to "understand" code, we need to install Extensions. Plugins are like specialized translators:
- Python Plugin: Tells VS Code what variables are, what functions are, and how to run
.pyfiles. - C++ Plugin: Tells VS Code how to call the compiler and how to debug memory.
This design makes VS Code very lightweight—if you don't write Java, you don't have to carry Java's runtime environment.
3.3 Behind the Scenes: From Code to Execution
Let's look at how VS Code, plugins, and the underlying environment collaborate through a specific scenario. Suppose you write a line of Python code and click Run or Debug:
1. Language Recognition (Activation)
VS Code detects the .py suffix and automatically wakes up the Python Plugin. The plugin immediately takes over the editor, begins syntax analysis, colors the code differently (syntax highlighting), and provides intelligent suggestions.
2. Task Delegation (Delegation)
When you issue a command, the plugin itself does not directly execute the code, but delegates the task to underlying professional tools:
- Run Mode: The plugin generates a command (such as
python main.py) and sends it to the system's terminal for execution. - Debug Mode: The plugin starts a Debug Adapter. It's like a "monitoring probe," connecting to the internals of the Python interpreter, allowing you to control code execution line by line.
3. Result Feedback (Feedback)
The Python interpreter (or compiler) executes the code and returns the results (or error messages) to the plugin. The plugin then "carries" this information back and displays it in VS Code's bottom terminal panel.
3.4 Summary: Using a "Restaurant" as an Analogy
If the above formula is a bit abstract, we can imagine the process of writing code as dining at a restaurant:
VS Code is the "Restaurant Lobby":
- The decoration is luxurious and the environment is comfortable (code highlighting, beautiful themes).
- But the lobby itself doesn't produce food. You sit here just to more comfortably "order" (write code).
Environment (Python/Node) is the "Kitchen":
- This is where the real cooking (running code) happens.
- If the restaurant has no kitchen (Python not installed), you can sit in the lobby until dark and still won't get food.
Plugins are the "Waiters":
- They connect the lobby and the kitchen.
- They understand your menu, run to tell the kitchen: "Table 3 wants a 'run main.py'!"
- When it's done, they bring the results (steaming hot food) back to you.
Conclusion:
- Only installing VS Code = Only lobby, no kitchen (can only look, can't eat).
- Only installing Python = Only kitchen, no lobby (can eat, but have to squat on the kitchen floor, poor experience).
- Installing VS Code + Plugins + Python = Perfect dining experience.
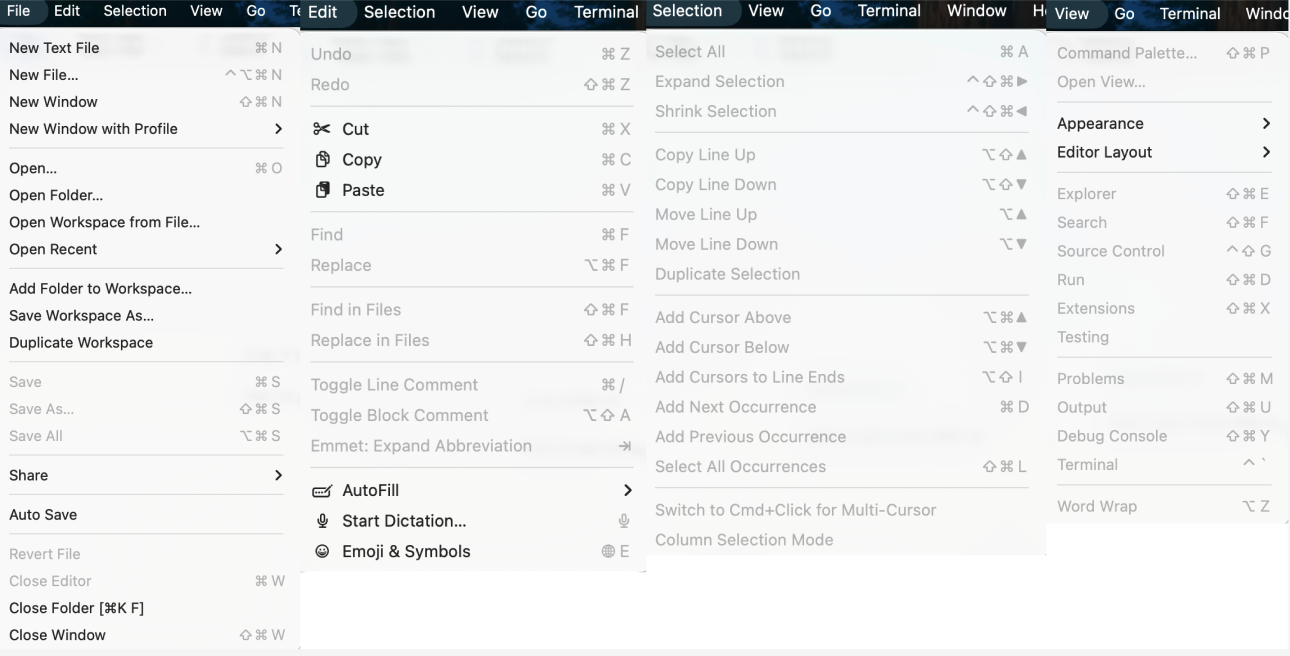
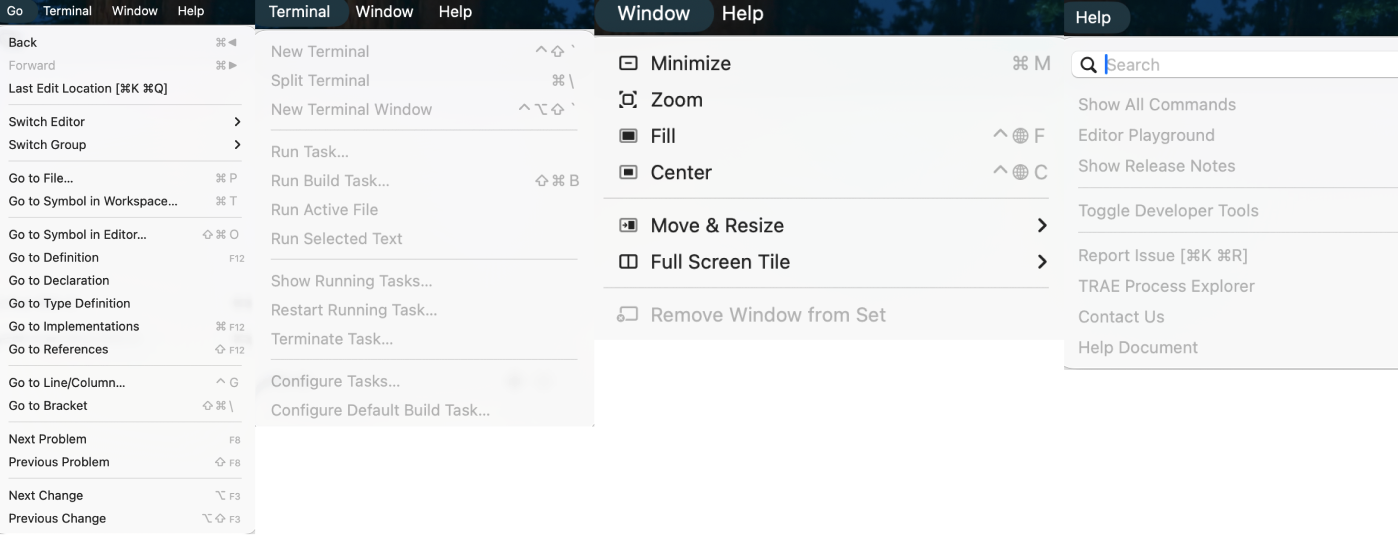
Appendix: Visual Studio Code Menu Bar Analysis
To help everyone understand the meaning of each option, here we provide an in-depth analysis of the menu bar: