
Diffusion World Models and Horizon Drift
Diffusion World Model (Diamond)
Diamond (2024) is the first world model to directly integrate the diffusion process into a reinforcement learning training loop. It surpasses all previous world model methods on the Atari 100k benchmark with a mean HNS of 1.46. The diffusion model conditions on historical frames and actions, then iteratively denoises to generate the next frame, where each denoising step is a full U-Net forward pass. This yields excellent generation fidelity at the cost of slow generation speed and difficulty maintaining object persistence.
FVD (Sequential Dynamics Quality)
As noted in the STORM section, FVD is the preferred reporting metric for sequence quality in diffusion world models. The FVD reported in the Diamond paper falls below that of real Atari gameplay frames, indicating that generation quality is statistically close to the ground truth.
Physics Consistency
This is a challenge unique to diffusion world models: high-fidelity per-frame generation does not guarantee that physical relationships remain consistent across a sequence. A concrete failure case: an object falling off a table may look realistic in each individual frame, yet the object might "snap back" onto the table in the next frame, violating gravity and persistence constraints.
Evaluation method: Run an object tracker over the evaluation sequence (e.g., SAM2, Segment Anything Model 2, a video segmentation and tracking model released by Meta in 2024 that can track the mask of any specified object in real time across video frames; or DINO feature matching, a visual feature extractor based on self-supervised Transformer pretraining, where DINO feature vectors of the same object across different frames have high cosine similarity and can be used for cross-frame correspondence matching). Track the position trajectories of key objects across consecutive frames and flag jump frames where inter-frame displacement exceeds a reasonable threshold. The physics consistency score is the proportion of frames with no violations; higher is better.
Action-Conditioning Fidelity
Diffusion world models condition frame generation on actions, but how the conditioning signal is injected determines how well the generated frames align with the actions. If the action signal is injected into only a few layers of the U-Net, the model may ignore the action conditioning and produce frames that are "visually plausible but action-irrelevant."
Evaluation method: Starting from the same initial frame, condition on two opposite actions (e.g., "move left" and "move right") and generate 5-step rollouts for each, then check whether the divergence between the two trajectories is consistent with the expected action effect. The fidelity metric is the action-direction divergence rate: the proportion of steps within
Depth Violation Rate
This is the most concrete automated diagnostic metric in the Diamond evaluation framework. The most visually salient manifestation of physics consistency violations is an inversion of three-dimensional relationships: an object that should be in the foreground appears behind a background object, or the occlusion relationship between two objects reverses across consecutive frames.
Computation procedure:
- Use DepthAnything (a monocular depth estimation model that estimates the relative depth of every pixel in a scene from a single RGB image, without requiring a stereo camera or LiDAR) to estimate a monocular depth map for each frame
- Use DINO features (see the physics consistency evaluation method above) to match key objects across adjacent frames and track the same object
- Check whether the depth value of the same object undergoes an abrupt change between adjacent frames (a change exceeding 20% of the total depth range)
- Depth violation rate = number of violating frame pairs / total number of adjacent frame pairs
Diagnostic rule: If the depth violation rate exceeds 10%, inject action information at every resolution level of the U-Net (rather than only at the bottleneck), and consider adding a depth consistency constraint to the loss function (an L1 penalty on the difference between depth maps of adjacent frames).
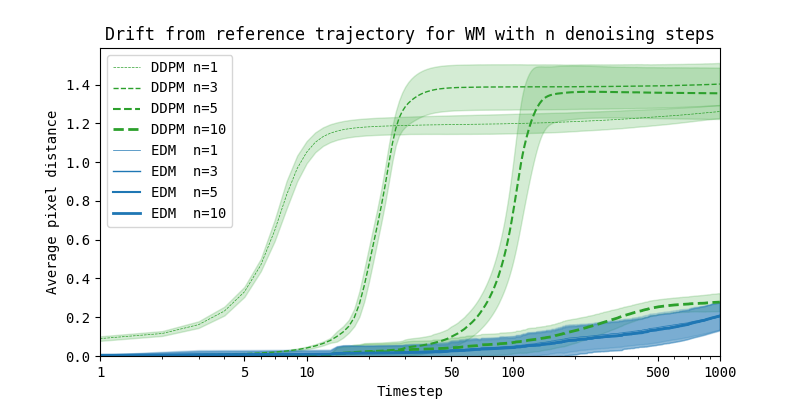
Horizon Drift: The Universal Failure Mode Across All World Models
Under a sufficiently long rollout, all architectures exhibit a systematic divergence of the latent state or generated content from the true world distribution. This is horizon drift. The specific form of drift varies by architecture:
| Architecture | Drift Manifestation |
|---|---|
| RNN/RSSM | Latent vector z_t drifts away from the region corresponding to real observations; PSNR degrades |
| Transformer (STORM) | Autoregressive errors accumulate; token prediction residuals grow progressively |
| Diffusion (Diamond) | Object identity, position, and occlusion relationships quietly shift over long sequences |
| TD-MPC | Latent consistency loss increases; planning efficiency degrades |
Detection: Drift Curves
Standard detection procedure: starting from a batch of real initial states, let the model roll out autoregressively for
Ideal curve: approximately linear increase over the first 5-10 steps, then leveling off to a plateau.
Warning signs: A drop of more than 30% from the initial value within the first 5 steps indicates that the model's single-step prediction error is too large, and rollout capability is essentially broken. Monotonic decrease with no sign of convergence within the first 20 steps indicates persistent error accumulation, meaning the model cannot maintain a reasonable state distribution during rollout.
Mitigation Strategies
1. Short Horizon Training
Limit the number of rollout steps during training to the range where the model can make reliable predictions, rather than forcing training on long sequences. For most architectures, 4-8 steps is a robust training window. Long-sequence training introduces noisier gradients and can actually degrade single-step accuracy. This is not a compromise: recognizing that "predicting 1 step reliably" is more useful for planning than "barely predicting 20 steps."
2. Target Network
When computing temporal-difference (TD) targets, use a copy network with slower parameter updates (a target network) rather than the main network. This cuts off backpropagation of errors along the time direction and reduces the cross-step accumulation of single-step prediction errors. Both TD-MPC and Dreamer V3 adopt this technique.
3. Real Data Interleaving
Periodically insert real trajectories into the minibatches used for imagined rollouts, so that the model's gradients are not driven entirely by its own predictions. Recommended ratio: insert 1 step of real data for every 4 steps of imagined rollout (25% real data). This also has the side effect of preventing KL collapse in RSSM.
4. Horizon Annealing
Start training with a short rollout (e.g., 1-2 steps), and gradually increase the rollout length as single-step accuracy improves (e.g., add 1 step every 10k training steps, up to a maximum of 8 steps). This avoids supervising the model on its own low-quality predictions early in training and reduces bootstrapping error.
Further Reading
- Alonso et al. (2024): Diamond: diffusion world model, NeurIPS 2024, mean HNS 1.46 on Atari 100k
- Zhang et al. (2023): STORM: Transformer-based dynamics world model, FVD evaluation baseline
- Carreira & Zisserman (2017): I3D: video feature extraction backbone used by FVD