
20. Profiling and Memory Ledger | 性能剖析与显存账本
难度: Medium | 环境: CPU-first | 标签: profiling, 显存, 性能分析 | 目标人群: Part 2-4 前置补课者
🚀 云端运行环境
本章节的实战代码可以点击以下链接在免费 GPU 算力平台上直接运行:
(国内推荐:魔搭社区免费实例)

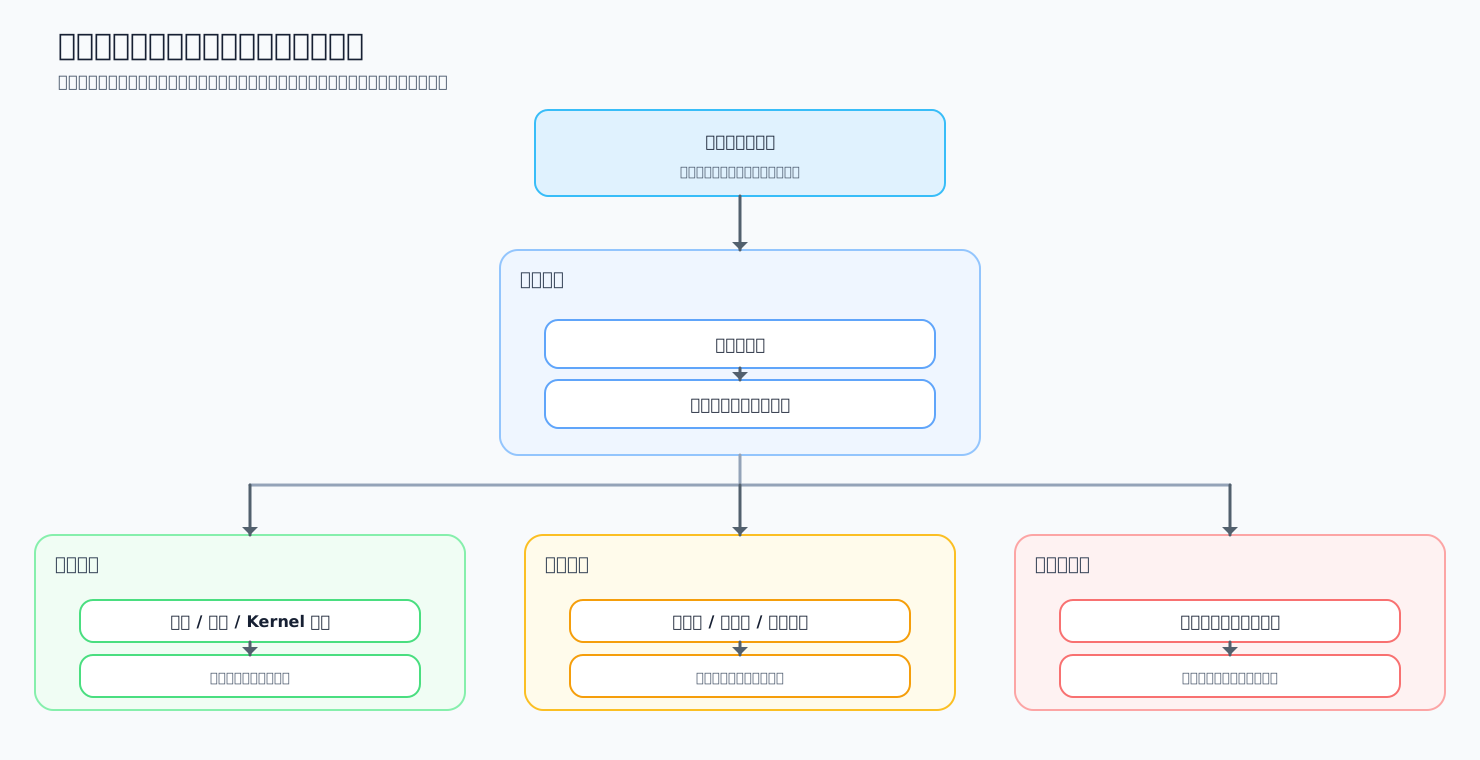
前面三节分别学习了如何观察时间、整理显存对象和定位异常。本节把这些观察合并成一次可复查的分析:先记录 baseline,再找出最值得展开的时间热点,接着判断显存风险来自哪个对象,最后只改变一个条件,设计下一项验证。你将在这个过程中把观察结果转成具体的实验动作。
关键词: profiler, latency, memory
前置阅读
导语: 完成 17 的时间观察、18 的显存账本和 19 的异常定位后,进入本页把证据整理成下一步实验决策。
- 17. PyTorch Profiling Basics | PyTorch 性能分析基础
- 18. Memory Profiling and Optimization | 显存分析与优化
- 19. Debugging and Anomaly Localization | 调试与异常定位
Q1:如何把一次运行的性能信号整理成可比较的记录?
假设你已经从一次运行中得到 step 时间、处理 token 数和资源观察值。两次运行的 latency 都是 20 ms,但一次处理 1 个样本、另一次处理 8 个样本,它们的 throughput 并不相同。这里把这些输入整理成一条 summary,方便与另一组 workload 或 baseline 比较;zone 表示初步归因类别,next_check 表示下一项检查。
| 记录字段 | 它回答的问题 | 输出或观察方向 |
|---|---|---|
| latency | 一次运行花了多久? | 判断单次响应是否变慢 |
| throughput | 单位时间处理了多少 token? | 判断整体产出是否下降 |
| GPU 利用率 | GPU 是否持续有工作? | 偏低时检查输入或同步 |
| CPU 等待时间 | CPU 是否在等待数据或设备? | 偏高时检查数据管线或同步 |
| summary | 当前运行呈现什么症状? | 输出 zone 和 next_check |
def summarize_step_metrics(step_ms, tokens, gpu_busy_pct, cpu_wait_ms):
    """汇总一次运行的性能症状,并给出下一步观察方向。

    这些判断是教学用启发式规则,不替代固定 workload 的实测。
    """
    if step_ms <= 0 or tokens < 0:
        raise ValueError('step_ms 必须大于 0,tokens 不能为负数')
    if not 0 <= gpu_busy_pct <= 100 or cpu_wait_ms < 0:
        raise ValueError('GPU 利用率应在 0 到 100 之间,CPU 等待时间不能为负数')
    tok_per_s = tokens / (step_ms / 1000.0)
    if cpu_wait_ms > 40 and gpu_busy_pct < 60:
        zone, next_check = 'likely_input_or_sync_bound', 'inspect_input_pipeline_or_sync'
    elif gpu_busy_pct < 50:
        zone, next_check = 'low_gpu_utilization', 'inspect_input_pipeline_or_sync'
    elif step_ms > 200:
        zone, next_check = 'slow_compute_path', 'inspect_forward_or_kernel'
    else:
        zone, next_check = 'no_single_signal', 'collect_more_evidence'
    return {
        'latency_ms': step_ms,
        'throughput_tok_s': round(tok_per_s, 1),
        'gpu_busy_pct': gpu_busy_pct,
        'cpu_wait_ms': cpu_wait_ms,
        'zone': zone,
        'next_check': next_check,
    }


examples = [
    ('输入或同步可疑', dict(step_ms=180, tokens=360, gpu_busy_pct=42, cpu_wait_ms=55)),
    ('计算路径可疑', dict(step_ms=260, tokens=520, gpu_busy_pct=86, cpu_wait_ms=8)),
    ('证据不足', dict(step_ms=160, tokens=360, gpu_busy_pct=72, cpu_wait_ms=8)),
]
for label, kwargs in examples:
    result = summarize_step_metrics(**kwargs)
    print(label, '->', result['zone'], '| next:', result['next_check'])

# 输出示例: summary 中 latency_ms=180, throughput_tok_s=2000.0, bottleneck=data
Q2:如何从阶段耗时中选出最值得展开的热点?
假设你已经从 17 节得到一组阶段事件。热点不是某一次调用最快,而是对总耗时贡献最大;例如 dataloader 占总时间最高时,说明输入、设备或同步等待值得优先检查,但还不能直接证明数据加载就是根因。这里按累计耗时和占比排序,再决定下一项验证是数据管线、前向 / 反向算子还是优化器更新。
| 阶段 | 观察对象 | 下一项验证 |
|---|---|---|
| dataloader | 数据准备和搬运 | 检查输入管线与同步 |
| forward | 前向算子与激活 | 展开算子耗时和显存 |
| backward | 反向计算与梯度 | 检查梯度计算和保存策略 |
| optimizer | 参数更新和状态访问 | 检查优化器循环与状态 |
| name | 阶段名称 | 与阶段记录对应 |
| total_ms | 阶段累计耗时 | 按累计耗时排序 |
| calls | 阶段调用次数 | 辅助解释累计耗时 |
| share_pct | 阶段占总耗时比例 | 优先展开占比高的阶段 |
def top_hotspots(events, topk=2):
    """按阶段总耗时排序,并补充其在总时间中的占比。

    events 中每项需要包含 name、total_ms 和 calls;这里处理的是
    已经整理好的事件记录,不负责从 profiler 采集原始事件。
    """
    if not isinstance(events, list) or not events or topk <= 0:
        return []
    required = {'name', 'total_ms', 'calls'}
    if any(not required.issubset(event) for event in events):
        raise ValueError('每个事件都必须包含 name、total_ms 和 calls')
    if any(event['total_ms'] < 0 or event['calls'] <= 0 for event in events):
        raise ValueError('total_ms 不能为负数,calls 必须大于 0')
    total_ms = sum(event['total_ms'] for event in events)
    if total_ms <= 0:
        raise ValueError('事件总耗时必须大于 0')
    ordered = sorted(events, key=lambda event: event['total_ms'], reverse=True)
    return [
        {**event, 'share_pct': round(event['total_ms'] / total_ms * 100, 1)}
        for event in ordered[:topk]
    ]


events = [
    {'name': 'forward', 'total_ms': 38, 'calls': 2},
    {'name': 'backward', 'total_ms': 74, 'calls': 2},
    {'name': 'optimizer', 'total_ms': 18, 'calls': 1},
    {'name': 'dataloader', 'total_ms': 52, 'calls': 4},
]
hotspots = top_hotspots(events)
print('hotspots:', hotspots)
print('focus:', hotspots[0]['name'])

# 输出示例: hotspots -> [('backward', 74), ('dataloader', 52)], focus -> backward
Q3:如何用显存账本判断容量风险来自哪个对象?
假设你已经知道一次训练步骤的大致输入规模。若 activation 占比随 batch 增长,而参数和优化器状态基本不变,容量风险更可能来自单步工作集。这里把参数、梯度、优化器状态、激活和临时缓冲放入同一份账本,识别主导对象;具体策略仍要交给固定 workload 的 benchmark。
| 显存对象 | 产生或驻留阶段 | 账本中的计算口径 | 主要影响因素 |
|---|---|---|---|
| 参数 | 模型加载后持续驻留 | 参数量 × 参数 dtype 字节数 | 参数量、dtype |
| 梯度 | backward 后产生,更新前保留 | 参数量 × 梯度 dtype 字节数 | 可训练参数量、梯度 dtype |
| 优化器状态 | 优化器初始化后驻留 | 参数量 × 状态字节数 | AdamW 等优化器、状态精度 |
| 激活 | forward 产生,backward 前保留 | 由输入规模和保存策略估算 | batch、sequence length、层数 |
| 临时缓冲 | 算子执行期间短暂产生 | 单独记录峰值或估算值 | 算子实现、workspace、layout |
def memory_ledger(param_count, param_bytes, grad_bytes, adam_state_bytes, activation_bytes, temporary_bytes=0):
    """按对象类别估算训练状态容量,并返回占比和下一项检查建议。

    param_bytes、grad_bytes 和 adam_state_bytes 表示每个参数对应的字节数;
    activation_bytes 和 temporary_bytes 是整块字节数。
    这是 CPU 可运行的理论账本,不读取真实 GPU allocator。
    """
    if param_count <= 0 or min(param_bytes, grad_bytes, adam_state_bytes, activation_bytes, temporary_bytes) < 0:
        raise ValueError('参数量必须大于 0,各类字节数不能为负数')
    total = param_count * (param_bytes + grad_bytes + adam_state_bytes) + activation_bytes + temporary_bytes
    components = {
        'parameters_mb': round(param_count * param_bytes / 1024**2, 2),
        'grads_mb': round(param_count * grad_bytes / 1024**2, 2),
        'adam_state_mb': round(param_count * adam_state_bytes / 1024**2, 2),
        'activation_mb': round(activation_bytes / 1024**2, 2),
        'temporary_mb': round(temporary_bytes / 1024**2, 2),
    }
    total_mb = round(total / 1024**2, 2)
    dominant_key = max(components, key=components.get)
    dominant_value = components[dominant_key]
    if dominant_key == 'activation_mb':
        recommended_check = 'compare_batch_or_checkpoint'
    elif dominant_key == 'adam_state_mb':
        recommended_check = 'inspect_optimizer_state_or_sharding'
    else:
        recommended_check = 'inspect_dtype_or_model_state'
    return {
        **components,
        'total_mb': total_mb,
        'shares_pct': {name: round(value / total_mb * 100, 1) for name, value in components.items()},
        'dominant': dominant_key.replace('_mb', ''),
        'dominant_share_pct': round(dominant_value / total_mb * 100, 1),
        'recommended_check': recommended_check,
    }


ledger = memory_ledger(
    param_count=1_000_000,
    param_bytes=2,
    grad_bytes=2,
    adam_state_bytes=8,
    activation_bytes=24 * 1024**2,
    temporary_bytes=4 * 1024**2,
)
print('ledger:', ledger)
print('shares_pct:', ledger['shares_pct'])
print('dominant:', ledger['dominant'])

# 输出示例: ledger 中 activation_mb 往往是主要开销
Q4:已经知道哪里慢、显存花在哪里后,下一步验证什么?
最后不要同时修改多个条件。若显存超过容量,先确认是 activation 还是常驻状态;若 dataloader 占主要时间,先检查输入管线;若通信位于关键路径,再检查通信频率和计算重叠。每次只选择一个最能区分假设的验证动作,并保持模型、输入、设备和重复次数一致。
每次实验先保留一条 baseline:固定模型、数据版本、输入长度、batch、dtype、设备和测量方法,只改变一个待验证条件。结果记录至少包含指标、变化量和 evidence level,避免把一次 smoke test 当成稳定结论。
| 实验记录项 | 当前证据或示例 | 下一项验证 |
|---|---|---|
| baseline | 未启用待测策略的固定配置 | 作为比较基线 |
| 唯一变量 | 只改变 batch、checkpoint、backend 等一个条件 | 保持其他条件不变 |
| 结果字段 | latency、throughput、峰值显存、质量指标 | 检查收益和代价 |
| 证据等级 | teaching proxy、smoke test 或 repeated benchmark | 判断结论可信度 |
| 显存无法容纳 workload | activation 还是常驻状态超出容量? | 比较 batch、checkpoint 或 offload |
| dataloader 占据主要时间 | 输入是否让 GPU 等待? | 检查数据管线和同步 |
| forward / backward 占据主要时间 | 哪个阶段的算子或保存策略更慢? | 展开对应阶段的 profiler 细节 |
| 通信位于关键路径 | 搬运是否暴露在总耗时中? | 检查通信频率与计算重叠 |
def choose_next_validation(ledger, capacity_mb, hotspot, communication_heavy):
    """根据账本容量、时间热点和通信信号生成下一项验证建议。

    返回值保留 hypothesis、change 和 metrics 字段,帮助学习者把
    排查方向转换成一条可记录的单变量实验计划。
    """
    can_fit = ledger['total_mb'] <= capacity_mb
    if not can_fit:
        return {'next_validation': 'compare_batch_checkpoint_offload', 'hypothesis': 'activation 或常驻状态超过容量', 'change': '只改变 batch 或 checkpoint', 'metrics': ['peak_memory_mb', 'throughput'], 'reason': '先确认是哪类对象超出容量'}
    if hotspot == "dataloader":
        return {'next_validation': 'inspect_input_pipeline', 'hypothesis': '输入准备或同步位于关键路径', 'change': '只改变数据管线设置', 'metrics': ['latency_ms', 'throughput'], 'reason': '时间热点位于数据加载'}
    if communication_heavy:
        return {'next_validation': 'inspect_communication_frequency_and_overlap', 'hypothesis': '通信暴露在关键路径', 'change': '只改变通信频率或重叠策略', 'metrics': ['latency_ms', 'communication_ms'], 'reason': '同步或通信可能位于关键路径'}
    if hotspot in {'forward', 'backward', 'optimizer'}:
        return {'next_validation': f'profile_{hotspot}_details', 'hypothesis': f'{hotspot} 阶段是主要耗时来源', 'change': '只展开该阶段的 profiler 证据', 'metrics': ['latency_ms', 'stage_share_pct'], 'reason': '先展开热点阶段,再决定具体改动'}
    return {'next_validation': 'collect_more_evidence', 'hypothesis': '当前证据不足以归因', 'change': '保持 workload 不变并增加重复采样', 'metrics': ['latency_ms', 'throughput'], 'reason': '当前信息不足'}


print('case1:', choose_next_validation(ledger, capacity_mb=32, hotspot='backward', communication_heavy=False))
print('case2:', choose_next_validation(ledger, capacity_mb=64, hotspot='dataloader', communication_heavy=False))
print('case3:', choose_next_validation(ledger, capacity_mb=64, hotspot='backward', communication_heavy=True))

# 输出示例: 这些结果只是下一步排查方向,不能直接当成最终优化结论
相关阅读
导语: 完成本节练习后,可以用下面的官方资料继续学习真实 profiler、CUDA 显存管理和 PyTorch 的运行时设计。