
13. Profiling and Bottleneck Analysis | 性能分析与瓶颈定位
难度: Medium | 环境: GPU optional | 标签: 系统性能, Profiling, 瓶颈分析 | 目标人群: 需要定位训练或推理性能瓶颈的学习者
🚀 云端运行环境
本章节的实战代码可以点击以下链接在免费 GPU 算力平台上直接运行:
(国内推荐:魔搭社区免费实例)

本节导读
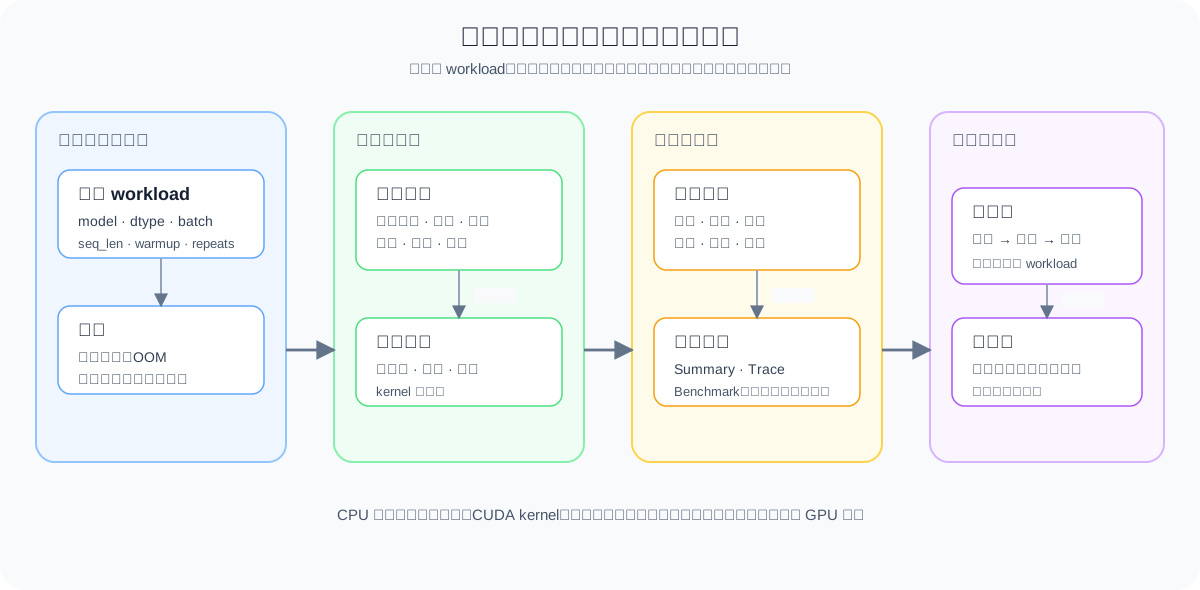
本节把“感觉变慢”转成可检查的问题:先把一次训练或推理拆成阶段,再用耗时、数据搬运、同步等待和 kernel 热点定位瓶颈。
学习路径是从现象到证据:CPU 练习先完成阶段计时、热点排序和瓶颈分类;真实 GPU profiler 再检查 CUDA kernel 时间、显存生命周期、同步等待和带宽利用率。
关键词: profiling, bottleneck, latency
前置阅读
导语: 先熟悉 GPU 的计算、访存和同步关系,再学习如何把一次训练或推理拆成可测量的阶段,并为下一步优化提出可复核的假设。
常用工具链
导语: profiling 不只是“看图”,更重要的是按层级选工具:先看时间线,再看 kernel,再回到代码。
torch.profiler:先看 Python / operator / CPU-GPU 时间线,回答“时间花在哪”。Nsight Systems:看整条时间线、stream overlap、通信与计算是否重叠,回答“调度是不是问题”。Nsight Compute:看单个 kernel 的 occupancy、memory throughput、warp stall 和 instruction mix,回答“kernel 为什么慢”。nvprof:可以作为历史工具了解,但当前更推荐前面两类工具。
工具的顺序通常是:先用 torch.profiler 找大方向,再用 Nsight Systems 看系统级重叠,最后用 Nsight Compute 钻到 kernel 细节。
Q1:开始 profiling 前,应该固定哪些测量条件?
点击展开查看解析
先固定 workload 和测量方法,再比较不同实现的差异。否则模型、输入长度、warmup 或同步方式的变化,会被误认为是优化收益。
| 测量条件 | 为什么要固定 | 最小记录 |
|---|---|---|
| model、dtype、batch、seq_len | 保证输入规模一致 | 配置与环境快照 |
| warmup 和 repeats | 排除首次编译与偶然抖动 | warmup 次数、重复次数 |
| CUDA synchronize | 让异步 GPU 工作正确计时 | 是否显式同步 |
step_time_ms、throughput、peak_memory | 同时观察速度与资源代价 | 训练 step 的均值 / 方差;显存峰值及 allocated / reserved 来源 |
训练项目使用 step_time_ms 和 samples/s 或 tokens/s;请求项目再使用 latency_ms、TTFT、TPOT 和 P50/P99。P50/P99 需要足够多的重复请求,不能直接替代单次训练 step 的统计。
固定条件后,再把阶段耗时拆成前向、反向、数据搬运和同步,形成第一轮瓶颈假设。
看到一个慢任务时,根据 workload 和指标判断它属于单请求延迟,还是单位时间处理量不足。
def build_measurement_plan(model='fixed-model', dtype='bf16', batch_size=1, seq_len=512, warmup=2, repeats=5, synchronize=True):
    """生成 profiling 前的最小测量计划;不执行真实 GPU profiling。"""
    if batch_size <= 0 or seq_len <= 0 or warmup < 0 or repeats <= 0:
        raise ValueError('batch_size、seq_len、repeats 必须为正数,warmup 不能为负数')
    return {
        'model': model, 'dtype': dtype, 'batch_size': batch_size,
        'seq_len': seq_len, 'warmup': warmup, 'repeats': repeats,
        'cuda_synchronize': synchronize,
    }

def summarize_profile(phases):
    """汇总阶段耗时;输入是阶段名到毫秒数的映射。"""
    if not phases:
        raise ValueError('phases 不能为空')
    if any(cost < 0 for cost in phases.values()):
        raise ValueError('阶段耗时不能为负数')
    total = sum(phases.values())
    if total <= 0:
        raise ValueError('阶段总耗时必须为正数')
    ranked = sorted(phases.items(), key=lambda kv: kv[1], reverse=True)
    shares = [(name, round(cost / total, 2)) for name, cost in ranked]
    return total, ranked[0], shares

plan = build_measurement_plan()
print('measurement_plan =', plan)
profile = {'forward': 32, 'backward': 18, 'h2d_copy': 10, 'sync': 5}
total, dominant, shares = summarize_profile(profile)
print('total_ms =', total)
print('dominant_stage =', dominant)
print('shares =', shares)
assert plan['cuda_synchronize'] is True
assert plan['repeats'] == 5
Q2:怎么区分算力、访存、搬运和调度瓶颈?
点击展开查看解析
先把观察信号、瓶颈假设和下一步证据放在同一张表中。三类瓶颈可能同时存在,因此表格用于提出第一轮假设,而不是替代 GPU profiler 的最终判断。
| 观察信号 | 初步假设 | 下一步动作 | 需要的证据 |
|---|---|---|---|
| FLOPs 利用率高、计算时间长 | 算力瓶颈 | 检查 GEMM、kernel 和 Tensor Core 利用率 | GPU profiler 的 kernel 与计算指标 |
| 带宽接近上限、访存时间长 | 访存瓶颈 | 检查数据复用、布局和内存访问 | memory timeline、带宽指标 |
| kernel 数量多、同步频繁 | 调度瓶颈 | 合并小操作、减少同步和 launch | trace、launch 与同步事件 |
| H2D / D2H 时间明显 | 搬运瓶颈 | 检查输入管线、offload 和设备切换 | memcpy trace、CPU/GPU 时间线 |
根据 FLOPs、带宽、kernel 数量和数据搬运信号,把问题归入算力、访存、调度或搬运假设。
def bottleneck_score(flop_util, bw_util, launch_count, transfer_util=0.0):
    """把利用率和 launch 数转成瓶颈压力分数。

    分数越高表示对应资源越接近压力上限;包含计算、设备内存、设备搬运和调度四类压力。
    这是 CPU 逻辑模拟,
    不是 GPU profiler 的实测指标。
    """
    if not all(0 <= value <= 1 for value in (flop_util, bw_util, transfer_util)):
        raise ValueError('flop_util、bw_util 和 transfer_util 必须位于 [0, 1]')
    if launch_count < 0:
        raise ValueError('launch_count 不能为负数')
    return {
        'compute': round(flop_util, 2),
        'memory': round(bw_util, 2),
        'transfer': round(transfer_util, 2),
        'scheduling': round(min(launch_count / 100.0, 1.0), 2),
    }

case = bottleneck_score(flop_util=0.42, bw_util=0.91, launch_count=18, transfer_util=0.18)
print(case)
print('main bottleneck =', max(case, key=case.get))
assert case['memory'] > case['compute']
assert max(case, key=case.get) == 'memory'
try:
    bottleneck_score(flop_util=1.2, bw_util=0.5, launch_count=1, transfer_util=0.1)
except ValueError:
    print('✅ 利用率范围校验通过')
else:
    raise AssertionError('超出范围的利用率应报错')
Q3:profiling 结果如何反过来指导优化?
点击展开查看解析
profiling 结果需要对应下一步动作:先根据时间线和指标定位资源,再选择要修改的实现。
- 如果是访存瓶颈,通常要考虑减少设备内存访问、合并 kernel、提高数据复用,或者换更好的 attention / cache 方案。
- 如果是算力瓶颈,通常要考虑更合适的矩阵实现、混合精度、Tensor Core 利用率或者更高效的 kernel 设计。
- 如果是搬运瓶颈,通常要检查 H2D / D2H 拷贝、offload 和输入管线,减少不必要的设备切换。
- 如果是调度瓶颈,通常要考虑减少 Python 开销、减少同步、合并小操作、优化 stream 组织。
这也是为什么 profiling 和 Triton、编译优化、系统调度会连在一起:它们不是并列知识点,而是“测量 -> 诊断 -> 重写”的连续链路。
把瓶颈先分清,再决定是改算子、改内存、改设备搬运还是改调度。
def recommend_actions(summary):
    """根据压力分数返回下一步优化方向;允许多个瓶颈同时存在。"""
    required = {'compute', 'memory', 'transfer', 'scheduling'}
    if set(summary) != required or any(not 0 <= value <= 1 for value in summary.values()):
        raise ValueError('summary 必须包含四个 [0, 1] 范围内的瓶颈分数')
    actions = []
    if summary['compute'] > 0.4:
        actions.append('improve kernel efficiency')
    if summary['memory'] > 0.4:
        actions.append('reduce memory traffic')
    if summary['transfer'] > 0.1:
        actions.append('reduce H2D / D2H transfers')
    if summary['scheduling'] > 0.1:
        actions.append('merge launches / reduce sync')
    return actions or ['keep profiling']

for case in [
    {'name': 'attention', 'flop_util': 0.38, 'bw_util': 0.96, 'transfer_util': 0.08, 'launch_count': 12},
    {'name': 'kernel', 'flop_util': 0.84, 'bw_util': 0.41, 'transfer_util': 0.05, 'launch_count': 8},
    {'name': 'python_overhead', 'flop_util': 0.92, 'bw_util': 0.88, 'transfer_util': 0.18, 'launch_count': 26},
]:
    summary = bottleneck_score(case['flop_util'], case['bw_util'], case['launch_count'], case['transfer_util'])
    print(case['name'], '->', summary, '=>', recommend_actions(summary))
assert 'reduce memory traffic' in recommend_actions(bottleneck_score(0.38, 0.96, 12, 0.08))
assert 'improve kernel efficiency' in recommend_actions(bottleneck_score(0.84, 0.41, 8, 0.05))
assert 'reduce H2D / D2H transfers' in recommend_actions(bottleneck_score(0.92, 0.88, 26, 0.18))
assert 'merge launches / reduce sync' in recommend_actions(bottleneck_score(0.92, 0.88, 26, 0.18))
相关阅读
本节可以从阶段耗时和瓶颈分类进入工具链,再用训练、推理项目复核“测量 → 诊断 → 优化”的证据链。