
74. Profiling Driven End to End Optimization | profiling 驱动的显存优化端到端收口
难度: Hard | 环境: CPU 可完成报告收口;GPU 用于可选 trace | 标签: 显存优化, 性能剖析, 端到端优化 | 目标人群: 项目决策练习者
🚀 云端运行环境
本章节的实战代码可以点击以下链接在免费 GPU 算力平台上直接运行:
(国内推荐:魔搭社区免费实例)

本节导读
当一次优化改变了训练时间或显存占用时,本节带你判断变化来自哪里,并用证据和复测决定是否保留这项改动。你将从已有结果提出瓶颈假设,再用针对性的证据和复测结果检查这个假设,最后形成可复查的优化结论。
关键词: profiling, optimization, end-to-end
前置阅读
导语: 先了解 profiling 的基本观察方法,再结合训练测量、显存预算和策略比较结果,进入本节的端到端证据分析。
- P1: 13. Profiling and Bottleneck Analysis | 性能分析与瓶颈定位
- 73. Training Performance Analysis | 训练性能分析
- 75. Memory Budget Compression Project | 显存预算压缩项目
- 76. Activation Checkpoint Offload Benchmark | Activation / Checkpoint / Offload 对比项目
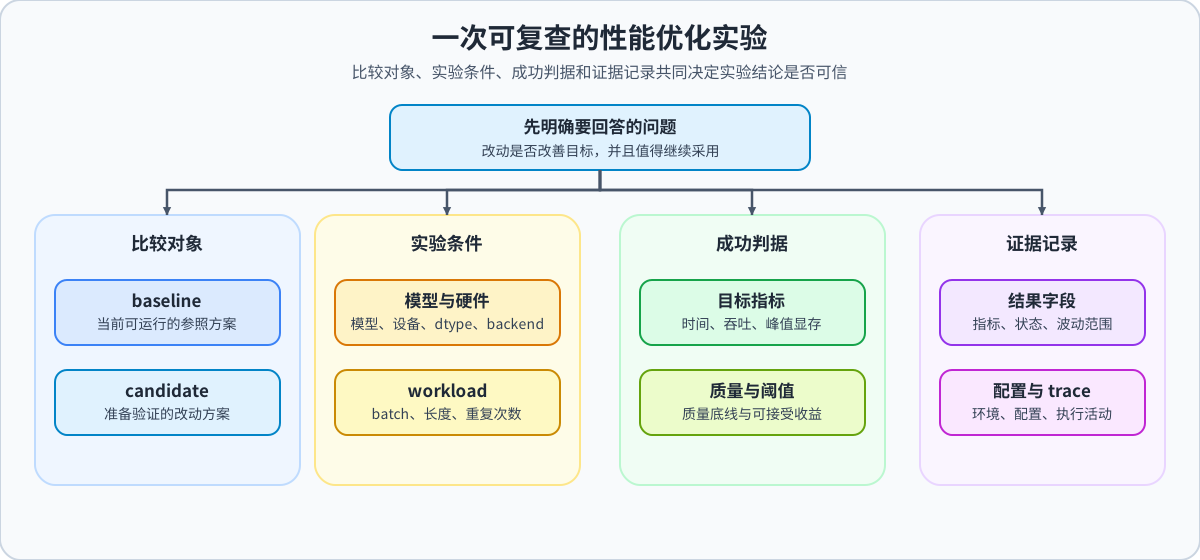
Step 1:定义比较对象与成功条件
先确定比较对象、成功指标、统一条件和记录字段,为后续分析建立可复查的实验口径。
| 项目要素 | 固定或产生的内容 | 你需要留下的记录 |
|---|---|---|
| 输入 | baseline、候选方案和共同 workload 条件 | 明确本次比较的对象与口径 |
| 目标 | step time、throughput、peak memory、等待时间或质量中的主要目标 | 写出可接受的成功阈值 |
| 证据 | 测量配置、trace 路径和结果文件 | 规定后续需要核对的执行活动 |
| 输出 | 比较计划、记录模板和成功条件 | 为后续瓶颈分析准备可复查的输入 |
Step 2:从基线结果提出瓶颈假设
先运行 baseline,观察总耗时、吞吐和峰值显存分别集中在哪些执行阶段;指标描述现象,trace 帮助定位原因。一次热点占比高不等于根因,还要结合 workload、硬件和测量轮次,整理成一句可以被复查的瓶颈假设。
| 场景 | 优先观察的阶段 | 需要形成的瓶颈假设 |
|---|---|---|
| 训练 | 数据加载、forward、backward、optimizer step、重算、搬运和通信 | 计算、容量、带宽、通信或调度中的主要约束 |
| 推理 | prefill、decode、KV cache、采样、搬运和 kernel | 例如:decode 阶段 KV cache 读取是主要瓶颈 |
Step 3:用对照实验检验瓶颈假设
围绕一个瓶颈假设,只改变一个变量,再用同一 workload 比较 baseline 与 tuned。
| 顺序 | 操作 | 记录内容 |
|---|---|---|
| 1 | 固定模型、workload、batch、seq_len、warmup、iters、backend 和硬件 | warmup 不计入正式测量 |
| 2 | 只改一个与 trace 相关的方向,如 batch、精度、kernel、同步或缓存 | 记录改动和对应证据 |
| 3 | 复测 step time、throughput、峰值显存及 loss / 精度 / 输出约束 | 比较收益与代价 |
| 4 | 对照预先设定的成功条件,判断证据是否支持假设 | 记录支持、不支持或证据不足 |
| 5 | 可选:如需使用 Roofline,补充 FLOPs、memory_bytes、硬件 peak 和 bandwidth | 记录 arithmetic intensity、bound 和 evidence level |

Step 4(CPU 代码练习):实现指标汇总与项目决策
把平均耗时、指标差值和 accept / tune / reject 决策实现成可运行代码;理论 Roofline 和报告格式已经提供,学习重点是把实验字段转换成项目判断。
| TODO | 函数 | CPU 实现重点 | 输出 |
|---|---|---|---|
| TODO 1 | benchmark_fn | warmup 不计入正式计时,使用 perf_counter() 统计平均耗时 | avg_time_ms |
| TODO 2 | summarize_optimization_result | 按指标方向计算 baseline / tuned 差值 | 时间、显存、吞吐差值 |
| 给定实现 | estimate_roofline | 阅读理论上限和证据级别,不读取 GPU 计数器 | arithmetic_intensity、bound、evidence_level |
| 给定实现 | format_optimization_report | 展示指标、瓶颈和下一步动作 | Markdown 报告 |
| TODO 3 | recommend_optimization_decision | 用时间、显存和吞吐阈值区分 accept / tune / reject | 项目决策 |
import timeimport time
def estimate_roofline(flops, memory_bytes, peak_flops, bandwidth):
"""用给定的理论参数估算 Roofline 上限;不读取 GPU 硬件计数器。"""
values = {
'flops': flops, 'memory_bytes': memory_bytes,
'peak_flops': peak_flops, 'bandwidth': bandwidth,
}
if any(value <= 0 for value in values.values()):
raise ValueError('flops/memory_bytes/peak_flops/bandwidth 必须为正数')
arithmetic_intensity = flops / memory_bytes
compute_roof = peak_flops
bandwidth_roof = bandwidth * arithmetic_intensity
attainable_roof = min(compute_roof, bandwidth_roof)
bound = 'compute' if compute_roof <= bandwidth_roof else 'memory'
return {
'arithmetic_intensity': arithmetic_intensity,
'compute_roof': compute_roof,
'bandwidth_roof': bandwidth_roof,
'attainable_roof': attainable_roof,
'bound': bound,
'evidence_level': 'theoretical_formula_only',
}
def benchmark_fn(fn, warmup=3, iters=10):
"""测量 CPU 函数的平均耗时;GPU trace 在 Step 5 独立采集。"""
if warmup < 0 or iters <= 0:
raise ValueError('warmup must be >= 0 and iters must be > 0')
# ==========================================
# TODO 1: 先做 warmup,再测量平均耗时
# 提示: 用 time.perf_counter() 记录起止时间
# 返回单位统一为 ms,方便和项目报告对齐
# ==========================================
for _ in range(warmup):
fn()
# start = ???
for _ in range(iters):
fn()
# total = ???
# avg_time_ms = ???
return avg_time_ms
def summarize_optimization_result(base_metrics, tuned_metrics):
"""统一计算 baseline - tuned 的时间、显存和吞吐差异。"""
# ==========================================
# TODO 2: 汇总 baseline / tuned 的核心指标差异
# 提示: 正数表示 tuned 相比 baseline 有改善
# step time / memory 越低越好,throughput 越高越好
# ==========================================
# time_delta = ???
# memory_delta = ???
# throughput_delta = ???
summary = {
'step_time_delta_ms': round(time_delta, 2),
'peak_mem_delta_mb': round(memory_delta, 2),
'throughput_delta': round(throughput_delta, 2),
'time_improved': time_delta > 0,
'memory_improved': memory_delta > 0,
'throughput_improved': throughput_delta > 0,
}
return summary
def format_optimization_report(summary, bottleneck, next_action):
"""输出指标变化、瓶颈证据边界和下一步动作。"""
header = "| 指标 | 变化 | 判断 |"
sep = "| --- | --- | --- |"
rows = [
f"| step time | {summary['step_time_delta_ms']} ms | {'改善' if summary['time_improved'] else '未改善'} |",
f"| peak memory | {summary['peak_mem_delta_mb']} MB | {'改善' if summary['memory_improved'] else '未改善'} |",
f"| throughput | {summary['throughput_delta']} | {'改善' if summary['throughput_improved'] else '未改善'} |",
]
conclusion = f"瓶颈判断:{bottleneck}。下一步:{next_action}。"
return "\n".join([header, sep] + rows + [conclusion])
def recommend_optimization_decision(summary, min_time_delta_ms=10.0, min_memory_delta_mb=512.0, min_throughput_delta=5.0):
"""使用显式阈值输出 accept / tune / reject,不把 CPU 结果写成 GPU 结论。"""
# ==========================================
# TODO 3:补全两处关键判断;其余阈值和决策分支已经给出。
# 规则:时间达到阈值且资源收益达标 -> accept;有正向变化但未达标 -> tune;否则 -> reject。
# ==========================================
# strong_time_gain = ??? # TODO 3a:对照 min_time_delta_ms
strong_memory_gain = summary['peak_mem_delta_mb'] >= min_memory_delta_mb
strong_throughput_gain = summary['throughput_delta'] >= min_throughput_delta
# positive_resource_gain = ??? # TODO 3b:显存或吞吐任一出现正向变化
if strong_time_gain and (strong_memory_gain or strong_throughput_gain):
decision = 'accept'
reason = '时间达到阈值,且显存或吞吐至少一项达到阈值,当前优化值得保留。'
elif strong_time_gain and positive_resource_gain:
decision = 'tune'
reason = '时间改善成立,但资源或吞吐收益还不够稳,建议继续微调。'
else:
decision = 'reject'
reason = '当前优化没有形成稳定的端到端收益,建议回退或重新定位瓶颈。'
return {'decision': decision, 'reason': reason}测试
def test_optimization_project_template():
    try:
        counter = {'n': 0}

        def fn():
            counter['n'] += 1

        result = benchmark_fn(fn, warmup=0, iters=2)
        assert counter['n'] == 2, "benchmark 应该运行 iters 次"
        assert result >= 0.0, "平均耗时应该非负"
        roofline = estimate_roofline(flops=2_000.0, memory_bytes=1_000.0, peak_flops=10.0, bandwidth=1.0)
        assert roofline['arithmetic_intensity'] == 2.0
        assert roofline['bound'] == 'memory'
        assert roofline['evidence_level'] == 'theoretical_formula_only'
        for invalid in ({'warmup': -1, 'iters': 2}, {'warmup': 0, 'iters': 0}):
            try:
                benchmark_fn(fn, **invalid)
            except ValueError:
                pass
            else:
                raise AssertionError('非法 warmup / iters 应明确拒绝')

        baseline = {'step_time_ms': 120.0, 'peak_mem_mb': 8192.0, 'throughput': 80.0}
        tuned = {'step_time_ms': 96.0, 'peak_mem_mb': 7168.0, 'throughput': 100.0}
        summary = summarize_optimization_result(baseline, tuned)

        assert summary['step_time_delta_ms'] == 24.0
        assert summary['peak_mem_delta_mb'] == 1024.0
        assert summary['throughput_delta'] == 20.0
        assert summary['time_improved'] is True
        assert summary['memory_improved'] is True
        assert summary['throughput_improved'] is True

        report = format_optimization_report(summary, 'backward kernel 占比过高', '保留混合精度并继续检查 optimizer')
        assert '| 指标 | 变化 | 判断 |' in report
        assert 'backward kernel 占比过高' in report
        assert '保留混合精度并继续检查 optimizer' in report

        decision = recommend_optimization_decision(summary, min_time_delta_ms=10.0, min_memory_delta_mb=512.0, min_throughput_delta=5.0)
        assert decision['decision'] == 'accept'

        memory_summary = {'step_time_delta_ms': 12.0, 'peak_mem_delta_mb': 768.0, 'throughput_delta': 0.0, 'time_improved': True, 'memory_improved': True, 'throughput_improved': False}
        memory_decision = recommend_optimization_decision(memory_summary, min_time_delta_ms=10.0, min_memory_delta_mb=512.0, min_throughput_delta=5.0)
        assert memory_decision['decision'] == 'accept'

        mixed_summary = {'step_time_delta_ms': 12.0, 'peak_mem_delta_mb': 128.0, 'throughput_delta': 2.0, 'time_improved': True, 'memory_improved': True, 'throughput_improved': True}
        mixed_decision = recommend_optimization_decision(mixed_summary, min_time_delta_ms=10.0, min_memory_delta_mb=512.0, min_throughput_delta=5.0)
        assert mixed_decision['decision'] == 'tune'

        weak_summary = {'step_time_delta_ms': -3.0, 'peak_mem_delta_mb': 64.0, 'throughput_delta': 1.0, 'time_improved': False, 'memory_improved': True, 'throughput_improved': True}
        weak_decision = recommend_optimization_decision(weak_summary, min_time_delta_ms=10.0, min_memory_delta_mb=512.0, min_throughput_delta=5.0)
        assert weak_decision['decision'] == 'reject'

        print("✅ profiling 驱动的端到端优化项目模板代码通过基础校验。")
    except NotImplementedError:
        print("请先完成 TODO 代码!")
        raise
    except AssertionError as e:
        print(f"❌ 测试失败: {e}")
        raise NotImplementedError("请先完成 TODO 代码!") from e


test_optimization_project_template()
🛑 STOP HERE 🛑
请先尝试自己完成代码并跑通测试。
如果你正在 Colab 中运行,并且遇到困难没有思路,可以向下滚动查看参考答案。
参考代码与解析
代码
import time


def estimate_roofline(flops, memory_bytes, peak_flops, bandwidth):
    """Estimate a theoretical Roofline bound; this does not collect hardware counters."""
    values = {
        'flops': flops, 'memory_bytes': memory_bytes,
        'peak_flops': peak_flops, 'bandwidth': bandwidth,
    }
    if any(value <= 0 for value in values.values()):
        raise ValueError('flops/memory_bytes/peak_flops/bandwidth must be positive')
    arithmetic_intensity = flops / memory_bytes
    compute_roof = peak_flops
    bandwidth_roof = bandwidth * arithmetic_intensity
    attainable_roof = min(compute_roof, bandwidth_roof)
    bound = 'compute' if compute_roof <= bandwidth_roof else 'memory'
    return {
        'arithmetic_intensity': arithmetic_intensity,
        'compute_roof': compute_roof,
        'bandwidth_roof': bandwidth_roof,
        'attainable_roof': attainable_roof,
        'bound': bound,
        'evidence_level': 'theoretical_formula_only',
    }

def benchmark_fn(fn, warmup=3, iters=10):
    if warmup < 0 or iters <= 0:
        raise ValueError('warmup must be >= 0 and iters must be > 0')
    # ==========================================
    # TODO 1: 先做 warmup,再测量平均耗时
    # 提示: 用 time.perf_counter() 记录起止时间
    # 返回单位统一为 ms,方便和项目报告对齐
    # ==========================================
    for _ in range(warmup):
        fn()

    start = time.perf_counter()
    for _ in range(iters):
        fn()
    total = time.perf_counter() - start
    avg_time_ms = total / iters * 1000
    return avg_time_ms


def summarize_optimization_result(base_metrics, tuned_metrics):
    # ==========================================
    # TODO 2: 汇总 baseline / tuned 的核心指标差异
    # 提示: 正数表示 tuned 相比 baseline 有改善
    # step time / memory 越低越好,throughput 越高越好
    # ==========================================
    time_delta = base_metrics['step_time_ms'] - tuned_metrics['step_time_ms']
    memory_delta = base_metrics['peak_mem_mb'] - tuned_metrics['peak_mem_mb']
    throughput_delta = tuned_metrics['throughput'] - base_metrics['throughput']

    summary = {
        'step_time_delta_ms': round(time_delta, 2),
        'peak_mem_delta_mb': round(memory_delta, 2),
        'throughput_delta': round(throughput_delta, 2),
        'time_improved': time_delta > 0,
        'memory_improved': memory_delta > 0,
        'throughput_improved': throughput_delta > 0,
    }
    return summary


def format_optimization_report(summary, bottleneck, next_action):
    header = "| 指标 | 变化 | 判断 |"
    sep = "| --- | --- | --- |"
    rows = [
        f"| step time | {summary['step_time_delta_ms']} ms | {'改善' if summary['time_improved'] else '未改善'} |",
        f"| peak memory | {summary['peak_mem_delta_mb']} MB | {'改善' if summary['memory_improved'] else '未改善'} |",
        f"| throughput | {summary['throughput_delta']} | {'改善' if summary['throughput_improved'] else '未改善'} |",
    ]
    conclusion = f"瓶颈判断:{bottleneck}。下一步:{next_action}。"
    return "\n".join([header, sep] + rows + [conclusion])


def recommend_optimization_decision(summary, min_time_delta_ms=10.0, min_memory_delta_mb=512.0, min_throughput_delta=5.0):
    # TODO 3 对应变量 strong_time_gain:对照 min_time_delta_ms。
    strong_time_gain = summary['step_time_delta_ms'] >= min_time_delta_ms
    strong_memory_gain = summary['peak_mem_delta_mb'] >= min_memory_delta_mb
    strong_throughput_gain = summary['throughput_delta'] >= min_throughput_delta
    positive_memory_gain = summary['peak_mem_delta_mb'] > 0
    positive_throughput_gain = summary['throughput_delta'] > 0
    # TODO 3 对应变量 positive_resource_gain:显存或吞吐任一出现正向变化。
    positive_resource_gain = positive_memory_gain or positive_throughput_gain
    if strong_time_gain and (strong_memory_gain or strong_throughput_gain):
        decision = 'accept'
        reason = '时间达到阈值,且显存或吞吐至少一项达到阈值,当前优化值得保留。'
    elif strong_time_gain and positive_resource_gain:
        decision = 'tune'
        reason = '时间改善成立,但资源或吞吐收益还不够稳,建议继续微调。'
    else:
        decision = 'reject'
        reason = '当前优化没有形成稳定的端到端收益,建议回退或重新定位瓶颈。'
    return {'decision': decision, 'reason': reason}
解析
这一版题目区保留 3 个核心 TODO:测量、汇总和轻量决策。报告格式由给定实现展示,学习者把精力放在 measure -> summarize -> decide 的可复用逻辑上。
- 这一题要解决什么:把 profiling 优化流程压缩成一个最小可复用模板,保证每次优化都能留下可比较的指标和明确结论。
- 为什么这样做:性能优化不能只看单次运行结果,必须固定 baseline、测量同一组指标,并把改动前后的差异收敛成项目报告。
- 带走的直觉:profiling 的价值不是“找到一个慢点”,而是建立
测量 -> 定位 -> 修改 -> 复测 -> 复盘的闭环。 - Roofline 的使用方式:
estimate_roofline只检查算术强度和理论上限;没有硬件 FLOP/DRAM 计数器时,答案不能把结果写成真实的 compute-bound 或 memory-bound。
1. TODO 1 (benchmark_fn)
- warmup:先运行若干轮,不计入统计,避免初始化、缓存和调度抖动影响结果。
- 计时范围:只把正式测量的
iters轮放进start / total之间。 - 单位统一:返回 ms,而不是秒,方便和 step time、latency 表格放在一起比较。
- 工程注意:本题区只测 CPU 函数耗时;GPU 同步、CUDA trace 和峰值显存由 Step 5 独立处理。
2. TODO 2 (summarize_optimization_result)
- step time 差值:
baseline - tuned,正数表示 tuned 更快。 - peak memory 差值:
baseline - tuned,正数表示 tuned 更省显存。 - throughput 差值:
tuned - baseline,正数表示 tuned 吞吐更高。 - 布尔判断:
time_improved / memory_improved / throughput_improved把数值变化变成可读结论,方便项目报告直接引用。
给定实现 (format_optimization_report)
报告模板把指标变化、瓶颈判断和下一步动作放在同一处;学习者只需理解这些字段如何承接 Step 3 的结论。
3. TODO 3 (recommend_optimization_decision)
- accept:时间达到阈值,且显存或吞吐至少一项达到阈值,说明这次改动对端到端目标形成了明确收益。
- tune:时间有改善,且显存或吞吐至少一项为正收益,但尚未达到对应阈值。
- reject:没有形成稳定的端到端收益,应该回退或重新定位瓶颈,而不是继续堆优化开关。
项目化原则
- 一次只改一个变量:否则收益不可归因。
- 指标要成组出现:只看变快不够,还要看显存、吞吐、loss / 精度或输出一致性。
- 结论要回扣目标:最终判断必须回答 Step 1 的问题:这次优化是否达成目标,是否值得保留。
Step 5(GPU 可选实验):采集真实 trace
5.1 环境、输入与 trace 计划
本实验固定 76 的训练 workload,只比较 baseline 与 checkpoint,观察 checkpoint 的额外重算是否解释了显存下降和时间增加。
| 实验要素 | 固定或设置的内容 | 形成的证据 |
|---|---|---|
| 实验问题 | checkpoint 是否用额外计算换取激活显存下降 | 可检验的瓶颈假设 |
| 固定条件 | Qwen/Qwen2.5-0.5B-Instruct、pressure、FP32、batch=1、seq_len=768、AdamW、warmup=2、iters=5 | 与 76 对齐的 workload |
| 对照变量 | baseline 对比 checkpoint;只改变激活值保存 / 重算策略 | 可归因的 trace 差异 |
| 采集范围 | 相同 ProfilerStep 区间,采集 CPU/CUDA trace | baseline / checkpoint 时间线 |
| 观察指标 | forward、backward、optimizer、重算、等待、step time、吞吐和峰值显存 | 瓶颈假设与复验依据 |
| 输出文件 | trace 路径、汇总指标、证据等级和下一步动作 | 74_real_gpu_profile.json |

5.2 环境预检
先检查项目路径、Python、PyTorch 和 CUDA。这个单元只报告环境状态,不安装依赖、不加载模型;预检未通过时,先根据输出修复环境。
"""GPU profiling 的独立环境预检:只确认路径和运行时,不安装依赖、不加载模型。"""
# 只检查项目路径、Python、PyTorch 和 CUDA;不安装依赖、不加载模型。
from pathlib import Path
import os
import subprocess
import sys

GPU_PROJECT_ROOT = Path(os.environ.get('LLM_ALGO_PROJECT_ROOT', Path.cwd())).expanduser().resolve()
if not (GPU_PROJECT_ROOT / 'tools/project_runtime.py').is_file():
    colab_root = Path('/content/llm-algo-leetcode')
    if (colab_root / 'tools/project_runtime.py').is_file():
        GPU_PROJECT_ROOT = colab_root
    elif Path('/content').is_dir() and not colab_root.exists():
        subprocess.run(['git', 'clone', 'https://github.com/datawhalechina/llm-algo-leetcode.git', str(colab_root)], check=True)
        GPU_PROJECT_ROOT = colab_root
if not (GPU_PROJECT_ROOT / 'tools/project_runtime.py').is_file():
    raise RuntimeError('找不到项目根目录:请设置 LLM_ALGO_PROJECT_ROOT,或先把仓库放到 /content/llm-algo-leetcode。')
os.chdir(GPU_PROJECT_ROOT)
if str(GPU_PROJECT_ROOT) not in sys.path:
    sys.path.insert(0, str(GPU_PROJECT_ROOT))
print(f'project_root: {GPU_PROJECT_ROOT}')
try:
    import torch
except ImportError:
    print('未检测到 PyTorch;请按维护文档安装匹配的 torch CUDA wheel 后再运行 profiling。')
else:
    print(f'torch: {torch.__version__}')
    print(f'cuda_build: {torch.version.cuda}; cuda_available: {torch.cuda.is_available()}')
    if torch.cuda.is_available():
        props = torch.cuda.get_device_properties(0)
        print(f'gpu: {props.name}; memory_gib: {props.total_memory / 2**30:.1f}')
5.3 配置 trace 条件
只修改 profiling 开关、采集策略和轮数;模型、输入、训练条件和指标计算逻辑保持不变。先采集最小 baseline / checkpoint 对照,再按需要扩展其他策略。
# 固定 workload,只修改 profiling 开关、采集策略和采集次数。
from pathlib import Path

RUN_REAL_PROFILE = False  # 默认先完成 CPU 报告收口;真实 GPU 采集时显式改为 True。
AUTO_INSTALL_REAL_DEPS = True  # 真实 profiling 开启时,只安装当前内核缺失的普通依赖。
AUTO_INSTALL_ALLOW_BREAK_SYSTEM_PACKAGES = True  # 云端 PEP 668 环境允许安装普通依赖;不会重装 PyTorch。
PROFILE_MODEL_ID = 'Qwen/Qwen2.5-0.5B-Instruct'
PROFILE_BATCH_SIZE = 1  # 必须与 76 的代表性 workload 对齐。
PROFILE_SEQ_LEN = 768  # 只 profile 一个代表性 workload;其他长度另存 trace。
PROFILE_WARMUP = 2  # 不计入 trace 结论的预热轮数。
PROFILE_ITERS = 5  # 短 trace 采集轮数;只用于归因,不替代 73 / 76 的正式均值。
PROFILE_STRATEGIES = ['baseline', 'checkpoint']  # 先采最小对照;candidate 应来自 76 的可行方案。
ROOFLINE_COUNTER_SOURCE = 'not_collected'  # torch.profiler 默认不保证 FLOP/DRAM 硬件计数器。
if PROFILE_BATCH_SIZE <= 0 or PROFILE_SEQ_LEN <= 0 or PROFILE_WARMUP < 0 or PROFILE_ITERS <= 0:
    raise ValueError('PROFILE_BATCH_SIZE/PROFILE_SEQ_LEN/PROFILE_ITERS 必须 > 0,PROFILE_WARMUP 不能为负数。')
if not PROFILE_STRATEGIES or len(PROFILE_STRATEGIES) != len(set(PROFILE_STRATEGIES)):
    raise ValueError('PROFILE_STRATEGIES 不能为空且不能包含重复策略。')
if any(strategy not in {'baseline', 'checkpoint', 'offload', 'hybrid'} for strategy in PROFILE_STRATEGIES):
    raise ValueError('PROFILE_STRATEGIES 只能使用 baseline/checkpoint/offload/hybrid。')
PROFILE_73_RELATIVE_PATH = Path('benchmarks/results/73_real_gpu_training.json')
PROFILE_76_RELATIVE_PATH = Path('benchmarks/results/76_real_gpu_memory.json')
PROFILE_TRACE_RELATIVE_DIR = Path('benchmarks/results/74_profile')
PROFILE_OUTPUT_RELATIVE_PATH = Path('benchmarks/results/74_real_gpu_profile.json')
5.4 执行 trace 采集
运行 cell 会按当前配置完成 baseline / candidate 的短训练并保存 trace 与 JSON。不同策略使用相同 ProfilerStep 区间;trace 用于提出瓶颈假设,不直接等同于最终结论。
# 按配置采集原始 trace 和 JSON;本 cell 不修改判定规则。
import gc
import json
import os
import subprocess
import sys
import time
from contextlib import nullcontext
from pathlib import Path

if RUN_REAL_PROFILE:
    import torch
    if AUTO_INSTALL_REAL_DEPS:
        import importlib.util
        missing = [name for name in ('transformers',) if importlib.util.find_spec(name) is None]
        if missing:
            install_cmd = [sys.executable, '-m', 'pip', 'install', '-U', *missing]
            markers = [Path(sys.prefix) / 'EXTERNALLY-MANAGED', Path(sys.executable).parent.parent / 'EXTERNALLY-MANAGED']
            if any(marker.is_file() for marker in markers):
                if not AUTO_INSTALL_ALLOW_BREAK_SYSTEM_PACKAGES:
                    raise RuntimeError('检测到 PEP 668 受管 Python,请启用 AUTO_INSTALL_ALLOW_BREAK_SYSTEM_PACKAGES 或改用独立虚拟环境。')
                install_cmd[3:3] = ['--break-system-packages']
            print('使用当前 Notebook 内核安装缺失依赖:', missing)
            subprocess.check_call(install_cmd)
            print('依赖安装完成;如当前内核仍找不到 transformers,请重启内核后继续。')
    from transformers import AutoConfig, AutoModelForCausalLM

    project_root = Path(os.environ.get('LLM_ALGO_PROJECT_ROOT', Path.cwd())).expanduser().resolve()
    for candidate in (project_root, *project_root.parents):
        if (candidate / 'benchmarks').is_dir() and (candidate / '02_PyTorch_Algorithms').is_dir():
            project_root = candidate
            break
    else:
        colab_root = Path('/content/llm-algo-leetcode')
        if colab_root.is_dir() and (colab_root / 'tools/project_runtime.py').is_file():
            project_root = colab_root
        elif Path('/content').is_dir() and not colab_root.exists():
            subprocess.run([
                'git', 'clone',
                'https://github.com/datawhalechina/llm-algo-leetcode.git',
                str(colab_root),
            ], check=True)
            project_root = colab_root
    if str(project_root) not in sys.path:
        sys.path.insert(0, str(project_root))
    from tools.model_runtime import resolve_model
    from tools.profiling_runtime import collect_training_trace
    from tools.project_runtime import environment_preflight, standard_experiment_config, standard_training_metrics
    preflight = environment_preflight(torch, required_packages=('transformers',), require_gpu=True)
    print({'environment_preflight': preflight})
    if not preflight['ready']:
        raise RuntimeError('环境预检未通过,请先按 next_actions 修复;没有开始 profiling。')

    baseline_73_path = project_root / PROFILE_73_RELATIVE_PATH
    if not baseline_73_path.exists():
        raise FileNotFoundError(f'找不到 73 baseline:{baseline_73_path}')
    baseline_73 = json.loads(baseline_73_path.read_text(encoding='utf-8'))
    baseline_73_config = baseline_73.get('config', {})
    upstream_path = project_root / PROFILE_76_RELATIVE_PATH
    if not upstream_path.exists():
        raise FileNotFoundError(f'找不到 76 结果:{upstream_path}')
    upstream = json.loads(upstream_path.read_text(encoding='utf-8'))
    upstream_config = upstream.get('config', {})
    missing_repeats = [item.get('name', '<unknown>') for item in upstream.get('candidates', []) if len(item.get('runs', [])) < 3]
    if missing_repeats:
        raise ValueError(f'74 需要 76 先完成每个候选的 3 次重复运行:{missing_repeats}')
    for key, value in {'model_id': PROFILE_MODEL_ID, 'batch_size': PROFILE_BATCH_SIZE, 'seq_len': PROFILE_SEQ_LEN}.items():
        if baseline_73_config.get(key) != value:
            raise ValueError(f'74 与 73 的 profiling workload 不一致:{key}={baseline_73_config.get(key)} != {value}')
        if upstream_config.get(key) != value:
            raise ValueError(f'74 与 76 的 profiling workload 不一致:{key}={upstream_config.get(key)} != {value}')

    model_path = resolve_model(PROFILE_MODEL_ID, source='auto', cache_dir='model_cache')
    model_config = AutoConfig.from_pretrained(model_path)
    generator = torch.Generator(device='cpu').manual_seed(42)
    input_ids_cpu = torch.randint(0, model_config.vocab_size, (PROFILE_BATCH_SIZE, PROFILE_SEQ_LEN), generator=generator)
    trace_root = project_root / PROFILE_TRACE_RELATIVE_DIR
    trace_root.mkdir(parents=True, exist_ok=True)
    candidates = []

    for strategy in PROFILE_STRATEGIES:
        trace_dir = trace_root / strategy
        trace_dir.mkdir(parents=True, exist_ok=True)
        model = AutoModelForCausalLM.from_pretrained(model_path, dtype=torch.float32)
        model.config.use_cache = False
        if strategy == 'checkpoint':
            model.gradient_checkpointing_enable()
        model.to('cuda').train()
        optimizer = torch.optim.AdamW(model.parameters(), lr=1e-5)
        input_ids = input_ids_cpu.to('cuda')
        labels = input_ids.clone()

        def train_step():
            optimizer.zero_grad(set_to_none=True)
            loss = model(input_ids=input_ids, labels=labels).loss
            loss.backward()
            optimizer.step()
            return loss

        measured = collect_training_trace(
            train_step, torch_module=torch, output_dir=trace_dir,
            warmup=PROFILE_WARMUP, iters=PROFILE_ITERS,
            batch_size=PROFILE_BATCH_SIZE,
        )
        trace_files = sorted(trace_dir.glob('*.pt.trace.json'))
        if not trace_files:
            raise RuntimeError(f'{strategy} 未生成 .pt.trace.json;请检查 profiler schedule 和输出目录:{trace_dir}')
        candidates.append({
            'name': strategy, 'status': 'ok', 'step_time_ms': measured['step_time_ms'],
            'samples_per_s': measured['samples_per_s'], 'loss': measured['loss'],
            'peak_memory_mb': measured['peak_memory_mb'], 'peak_reserved_mb': measured['peak_reserved_mb'],
            'trace_dir': str(trace_dir.relative_to(project_root)), 'top_operators': measured['top_operators'],
        })
        del optimizer, model, input_ids, labels
        gc.collect()
        torch.cuda.empty_cache()

    report = {
        'task': 'task3_training_memory_optimization', 'stage': 'real_profiler_trace',
        'config': {'model_id': PROFILE_MODEL_ID, 'batch_size': PROFILE_BATCH_SIZE, 'seq_len': PROFILE_SEQ_LEN, 'dtype': 'float32', 'strategies': PROFILE_STRATEGIES, 'warmup': PROFILE_WARMUP, 'iters': PROFILE_ITERS},
        'source_73': str(baseline_73_path.relative_to(project_root)), 'source_76': str(upstream_path.relative_to(project_root)), 'trace_root': str(trace_root.relative_to(project_root)),
        'candidates': candidates, 'profile': {'tool': 'torch.profiler', 'activities': ['CPU', 'CUDA'], 'status': 'collected', 'trace_files_by_strategy': {item['name']: [str(path.relative_to(project_root)) for path in sorted((trace_root / item['name']).glob('*.pt.trace.json'))] for item in candidates}},
    }
    report['experiment'] = standard_experiment_config({
        'model_id': PROFILE_MODEL_ID, 'backend': 'torch.profiler',
        'dtype': 'float32', 'optimizer': 'AdamW',
        'batch_size': PROFILE_BATCH_SIZE, 'seq_len': PROFILE_SEQ_LEN,
        'warmup': PROFILE_WARMUP, 'iters': PROFILE_ITERS, 'seed': 42,
        'device': torch.cuda.get_device_name(0),
        'torch': torch.__version__, 'cuda': torch.version.cuda,
    })
    report['standard_metrics'] = {item['name']: standard_training_metrics(item) for item in candidates}
    output_path = project_root / PROFILE_OUTPUT_RELATIVE_PATH
    output_path.parent.mkdir(parents=True, exist_ok=True)
    output_path.write_text(json.dumps(report, ensure_ascii=False, indent=2), encoding='utf-8')
    print(json.dumps(report, ensure_ascii=False, indent=2))
else:
    print('跳过真实 profiler:保持 CPU-first 模式。')
5.5 读取结果与记录证据
这一单元读取已经保存的上游 JSON 和真实 profiler 报告,核对实测环境、trace 文件和主线结果,最后生成 benchmarks/results/74_profiling_optimization.json。时间线观察、证据解释和复验动作放在 5.6;如果没有真实 profiling 证据,报告会明确标记为 tune。
import json
from pathlib import Path
import sys

project_root = Path.cwd().resolve()
for candidate_root in (project_root, *project_root.parents):
    if (candidate_root / 'tools/project_runtime.py').is_file():
        if str(candidate_root) not in sys.path:
            sys.path.insert(0, str(candidate_root))
        break
from tools.project_runtime import resolve_project_root, standard_experiment_config, standard_training_metrics

RUN_REAL_PROJECT = True  # True:读取已有 73/76/75 JSON 并生成 74 报告。
PROJECT_ROOT = resolve_project_root()

UPSTREAM_PATHS = {
    '73': PROJECT_ROOT / 'benchmarks/results/73_real_gpu_training.json',
    '76': PROJECT_ROOT / 'benchmarks/results/76_real_gpu_memory.json',
    '75': PROJECT_ROOT / 'benchmarks/results/75_memory_budget_decision.json',
}
OUTPUT_PATH = PROJECT_ROOT / 'benchmarks/results/74_profiling_optimization.json'
PROFILE_TRACE_DIR = PROJECT_ROOT / 'benchmarks/results/74_profile'  # torch.profiler 输出目录。
PROFILE_REPORT_PATH = PROJECT_ROOT / 'benchmarks/results/74_real_gpu_profile.json'

def load_required_reports(paths):
    missing = [str(path) for path in paths.values() if not path.is_file()]
    if missing:
        raise FileNotFoundError('缺少上游报告:' + ', '.join(missing))
    return {name: json.loads(path.read_text(encoding='utf-8')) for name, path in paths.items()}

def inspect_profile_trace(trace_dir, expected_strategies=None):
    """只确认 trace 是否存在,不把文件存在误写成瓶颈结论。"""
    trace_dir = Path(trace_dir)
    expected_strategies = list(expected_strategies or [])
    trace_files = sorted(
        path for path in trace_dir.rglob('*')
        if path.is_file() and path.name.endswith('.pt.trace.json')
    ) if trace_dir.is_dir() else []
    if not trace_files:
        return {
            'status': 'not_collected', 'tool': None, 'trace_dir': str(trace_dir),
            'trace_files': [], 'evidence': [],
        }
    strategy_dirs = {name: sorted((trace_dir / name).glob('*.pt.trace.json')) for name in expected_strategies}
    missing_strategies = [name for name, files in strategy_dirs.items() if not files]
    return {
        'status': 'collected', 'tool': 'torch.profiler', 'trace_dir': str(trace_dir),
        'trace_files': [str(path) for path in trace_files],
        'evidence': ['trace_file_exists'] if not missing_strategies else ['trace_file_exists', 'missing_expected_strategy_trace'],
        'expected_strategies': expected_strategies,
        'missing_strategies': missing_strategies,
        'trace_files_by_strategy': {name: [str(path) for path in files] for name, files in strategy_dirs.items()},
    }

def build_upstream_report(reports):
    if PROFILE_REPORT_PATH.is_file():
        profile_seed = json.loads(PROFILE_REPORT_PATH.read_text(encoding='utf-8'))
        expected_strategies = [item.get('name') for item in profile_seed.get('candidates', []) if item.get('name')]
    else:
        expected_strategies = ['baseline', 'checkpoint']
    profiling = inspect_profile_trace(PROFILE_TRACE_DIR, expected_strategies=expected_strategies)
    if PROFILE_REPORT_PATH.is_file():
        profile_report = json.loads(PROFILE_REPORT_PATH.read_text(encoding='utf-8'))
        profiling['report_path'] = str(PROFILE_REPORT_PATH)
        profiling['top_operators'] = {item['name']: item.get('top_operators', '') for item in profile_report.get('candidates', [])}
    if profiling['status'] == 'collected' and not profiling.get('missing_strategies'):
        profile_decision = {'decision': 'tune', 'reason': 'profiler_trace_collected_but_requires_bottleneck_interpretation', 'next_action': 'interpret_trace_and_validate_one_change'}
    else:
        profile_decision = {'decision': 'tune', 'reason': 'profiler_trace_incomplete_for_declared_candidates', 'next_action': 'collect_missing_strategy_trace_and_rerun_same_workload'}
    report = {
        'schema_version': 'profiling-project/v1',
        'project': '74_profiling_driven_end_to_end_optimization',
        'stage': 'upstream_report_merge',
        'sources': {name: str(path.relative_to(project_root)) for name, path in UPSTREAM_PATHS.items()},
        'upstream': {
            '73_training_baseline': reports['73'].get('baseline'),
            '76_strategy_summary': reports['76'].get('summary'),
            '76_decision': reports['76'].get('decision'),
            '75_budget_summary': reports['75'].get('summary'),
            '75_decision': reports['75'].get('decision'),
        },
        'profiling': profiling,
        'roofline': {
            'status': 'not_collected',
            'counter_source': ROOFLINE_COUNTER_SOURCE,
            'evidence_level': 'no_hardware_counter_evidence',
        },
        'decision': profile_decision,
    }
    report['experiment'] = standard_experiment_config(reports['76'].get('config', {}))
    report['standard_metrics'] = {
        item.get('name', f'candidate_{index}'): standard_training_metrics(item)
        for index, item in enumerate(reports['76'].get('candidates', []))
        if isinstance(item, dict)
    }
    return report

if RUN_REAL_PROJECT:
    upstream_reports = load_required_reports(UPSTREAM_PATHS)
    project_report = build_upstream_report(upstream_reports)
    OUTPUT_PATH.parent.mkdir(parents=True, exist_ok=True)
    OUTPUT_PATH.write_text(json.dumps(project_report, ensure_ascii=False, indent=2), encoding='utf-8')
    print(json.dumps(project_report, ensure_ascii=False, indent=2))
else:
print('跳过 74 上游报告收口:保持 CPU-first 模式。')# 运行本单元,自动整理真实 profiler 数据和结论。
import json
from pathlib import Path
project_root = Path.cwd().resolve()
for candidate_root in (project_root, *project_root.parents):
if (candidate_root / 'benchmarks').is_dir() and (candidate_root / '02_PyTorch_Algorithms').is_dir():
project_root = candidate_root
break
else:
colab_root = Path('/content/llm-algo-leetcode')
if (colab_root / 'benchmarks').is_dir():
project_root = colab_root
PROJECT_ROOT = project_root
profile_report_path = PROJECT_ROOT / 'benchmarks/results/74_real_gpu_profile.json'
close_report_path = PROJECT_ROOT / 'benchmarks/results/74_profiling_optimization.json'
if not profile_report_path.is_file():
raise FileNotFoundError(f'找不到真实 profiler 报告:{profile_report_path}')
profile_report = json.loads(profile_report_path.read_text(encoding='utf-8'))
rows = []
for item in profile_report.get('candidates', []):
rows.append({
'strategy': item.get('name'),
'step_time_ms': item.get('step_time_ms'),
'samples_per_s': item.get('samples_per_s'),
'peak_memory_mb': item.get('peak_memory_mb'),
'peak_reserved_mb': item.get('peak_reserved_mb'),
'status': item.get('status'),
'trace_dir': item.get('trace_dir'),
})
print('74 真实 profiler 数据(仅 baseline / checkpoint)')
print(json.dumps({
'config': profile_report.get('config'),
'candidates': rows,
'trace': profile_report.get('profile'),
}, ensure_ascii=False, indent=2))
if len(rows) == 2 and all(row['status'] == 'ok' for row in rows):
base = next(row for row in rows if row['strategy'] == 'baseline')
tuned = next(row for row in rows if row['strategy'] == 'checkpoint')
print('\n可比较指标')
print(f"显存变化:{base['peak_memory_mb']:.2f} → {tuned['peak_memory_mb']:.2f} MB,减少 {base['peak_memory_mb'] - tuned['peak_memory_mb']:.2f} MB")
print(f"步耗时变化:{base['step_time_ms']:.2f} → {tuned['step_time_ms']:.2f} ms,增加 {tuned['step_time_ms'] - base['step_time_ms']:.2f} ms")
print(f"吞吐变化:{base['samples_per_s']:.3f} → {tuned['samples_per_s']:.3f} samples/s")
print('解释:checkpoint 降低了峰值显存,但增加了计算时间;这是用重算换显存。')
print('证据边界:当前 trace 可以支持 baseline / checkpoint 的时间线对比,不能单独证明某个 kernel 的硬件效率或最终 accept。')
if close_report_path.is_file():
close_report = json.loads(close_report_path.read_text(encoding='utf-8'))
print('\n项目收口')
print(json.dumps(close_report.get('decision', {}), ensure_ascii=False, indent=2))
print('下一步:在 Perfetto 中分别打开 baseline / checkpoint trace,确认 forward、backward 和 optimizer step 的时间线,再验证一个针对瓶颈的改动。')实测环境与统一口径
74 使用与 73、76 相同的本地 GPU 环境;只对 baseline 和 checkpoint 采集 trace,offload / hybrid 的策略指标见 76 节。
| 统一条件 | 实际配置 |
|---|---|
| 系统 / GPU | Linux 6.8.0-138-generic、RTX 5070 Ti Laptop GPU / 12227 MiB |
| 驱动 | 570.211.01 |
| PyTorch / CUDA | 2.11.0+cu128 / 12.8 |
| 模型与 revision | Qwen/Qwen2.5-0.5B-Instruct / 待填写 |
| dtype / optimizer | FP32 / AdamW |
| batch / seq_len | 1 / 768 |
| warmup / iters / profiler repeats | 2 / 5 / 1 |
| trace 输出 / evidence level | benchmarks/results/74_profile/ / profiling_trace 或 not_collected |
主线结果与 trace 状态
下表记录 baseline 与 checkpoint 在同一 workload 下的实测结果,以及对应 trace 是否已经生成。
| 策略 | 单步耗时(ms) | 吞吐(samples/s) | 峰值显存(MB) | reserved(MB) | last loss | Trace |
|---|---|---|---|---|---|---|
| baseline | 690.375 | 1.448 | 9782.73 | 10750.00 | 11.477463 | 已采集 |
| checkpoint | 825.059 | 1.212 | 9450.75 | 10896.00 | 11.477463 | 已采集 |
5.6 解释与决策
先用固定 workload 的结果判断显存与时间的交换,再用 Chrome trace 解释时间差来自重算、等待还是同步。Profiler 会引入额外开销,因此表中耗时只用于相对比较;最终性能以关闭 profiler 的重复测量为准。本次 trace 仅覆盖 baseline 与 checkpoint,offload / hybrid 的结论引用 76 节结果,不在本节推断。
对照结果
下表中的数字只对应本次固定模型、输入和训练条件;当前决策还需要结合后面的时间线证据和改动复验。
| 对比项 | 结果 |
|---|---|
| 峰值显存 | checkpoint 减少 331.98 MB,约 3.39% |
| 单步耗时 | 增加 134.68 ms,约 19.51% |
| 吞吐 | 从 1.448 降至 1.212 samples/s,约下降 16.30% |
| 当前决策 | tune:已取得 trace,仍需完成瓶颈解释和改动复验 |
Profiler 证据记录
使用 Perfetto 打开 baseline 和 checkpoint 的 torch.profiler Chrome trace,在相同 ProfilerStep 区间观察 forward、backward、optimizer step、重算和等待。时间占比只能作为线索,不能单独证明瓶颈;需要把观察到的现象、支持的假设和下一次复验动作填入下表。
| 策略 | trace 路径 | 关键观察 | 支持的假设 | 仍需复验 |
|---|---|---|---|---|
| baseline | benchmarks/results/74_profile/baseline/*.pt.trace.json | 已采集;填写 forward / backward / optimizer 占比 | 作为时间线参照 | 填写主要等待或热点 |
| checkpoint | benchmarks/results/74_profile/checkpoint/*.pt.trace.json | 已采集;填写 backward 重算活动 | 是否用计算换显存 | 用同一 workload 复验改动 |
| offload / hybrid | 由 76 决定是否扩展 | 当前未采集 | 只能引用 76 的指标 | 明确 trace 策略后再采集 |
相关阅读
以下资料按“profiling 基础 → profiler 工具”排列,用于支持本节的 trace 阅读和证据解释。73、75、76 等项目入口已放在前置阅读中。